Created by Kristoffer Magnusson, from an idea by Daniel Lakens and formulas from JP de Ruiter.
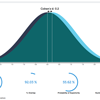
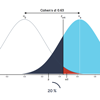
Many know that p-values follow an uniform distribution when the null hypothesis is true. But what about when the null isn't true? This visualization shows the distribution of p-values when comparing the means of two independent samples. Check out this blog post by Daniel Lakens for more information.
This visualization is based on a two-sample Z-test, i.e. we assume that the true standard deviation is known. In real life this is often not the case, which is why t-tests are much more common. When the effect is nonzero p-values from t-tests follow a non-central t distribution. However, the formulas used here works quite well as normal approximation of the non-central t distribution, but it is slightly biased when n is small. As an educational tool this hardly makes a difference, since the take-home message is the amount of skew when the true effect is greater than zero. This approach is also used by Cumming (2008).
The content on this blog is shared for free under a CC-BY license. If you like my work and want to support it you can:
![]() Buy me a coffee (or use PayPal)
Buy me a coffee (or use PayPal)
You can also sponsor my open source work using GitHub Sponsors
Have any suggestion? Send them to me, my contact info can be found here.