Created by Kristoffer Magnusson
It is not uncommon to see researchers conclude that two treatments are equally effective, based on an insignificant test of the null hypothesis. Or that reducing the length of a treatment yields treatment effects that are no worse than the standard (longer) treatment, based on p > 0.05. Clearly, both conclusions are wrong. Much has been written about this, and in medicine the appropriate types of tests for these kinds of hypotheses are equivalence and non-inferiority tests. When testing for equivalence, we test whether a treatment effect is inside a prespecified equivalence margin [-Δ, Δ]. Similarly, when testing if a treatment is at least not worse than another treatment, we test if the effect is above a prespecified non-inferiority margin -Δ. My aim with this visualization is to show the decision rules associated with these different types of hypotheses. This visualization also shows how power relates to the different tests and different values of Δ, d and n.
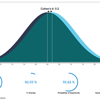
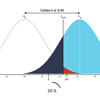
Below I use a 95 % confidence interval to demonstrate the different hypotheses. You can move the CI around using the sliders or by clicking and dragging. Results of the test of treatment differences will automatically be highlighted.
 95 % CI
$$ 1 - \beta = \Phi \left( \frac{|d - \Delta|}{\sqrt{2/n}} - Z_{1-\alpha}\right) + \Phi \left( \frac{|d + \Delta|}{\sqrt{2/n}} - Z_{1-\alpha}\right) - 1$$
where \(\Phi\) is the cumulative distribution function of the standard normal distribution. \(d\) is Cohen's d, \(\Delta\) is non-inferiority or equivalence margin, \(n\) is the sample size per group, and is the \(Z_{1-\alpha}\) is the 100(\(1-\alpha\))th percentile of a standard normal distribution.
Formulas are adapted from Julious, Steven A. "Sample sizes for clinical trials with normal data." Statistics in medicine 23.12 (2004): 1921-1986.
The content on this blog is shared for free under a CC-BY license. If you like my work and want to support it you can:
![]() Buy me a coffee (or use PayPal)
Buy me a coffee (or use PayPal)
You can also sponsor my open source work using GitHub Sponsors
Have any suggestion? Or found any bugs? Send them to me, my contact info can be found here.