PostsVisualizationsAbout

Visualizations

Interactive tools for building intuition about statistical concepts.
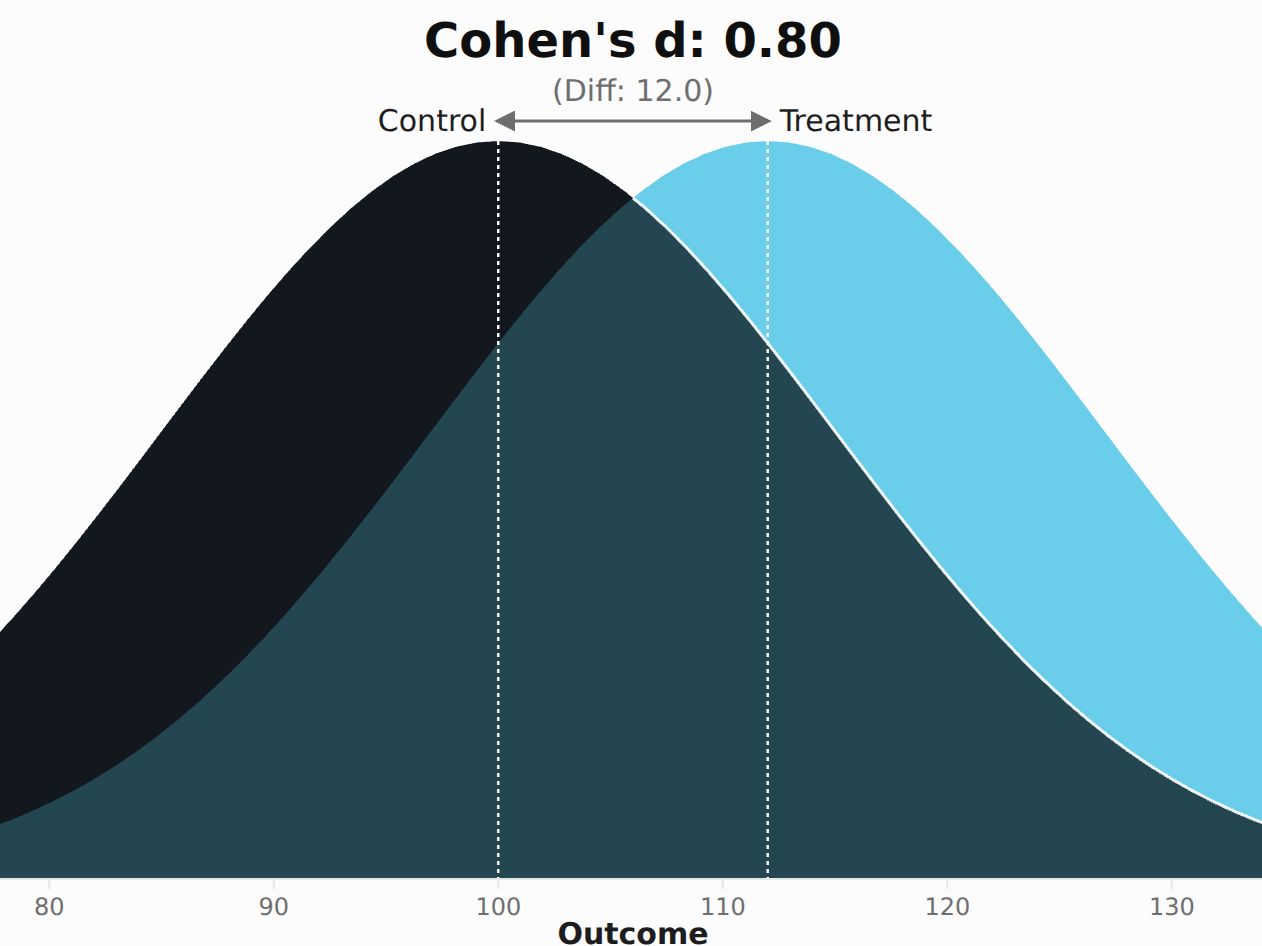
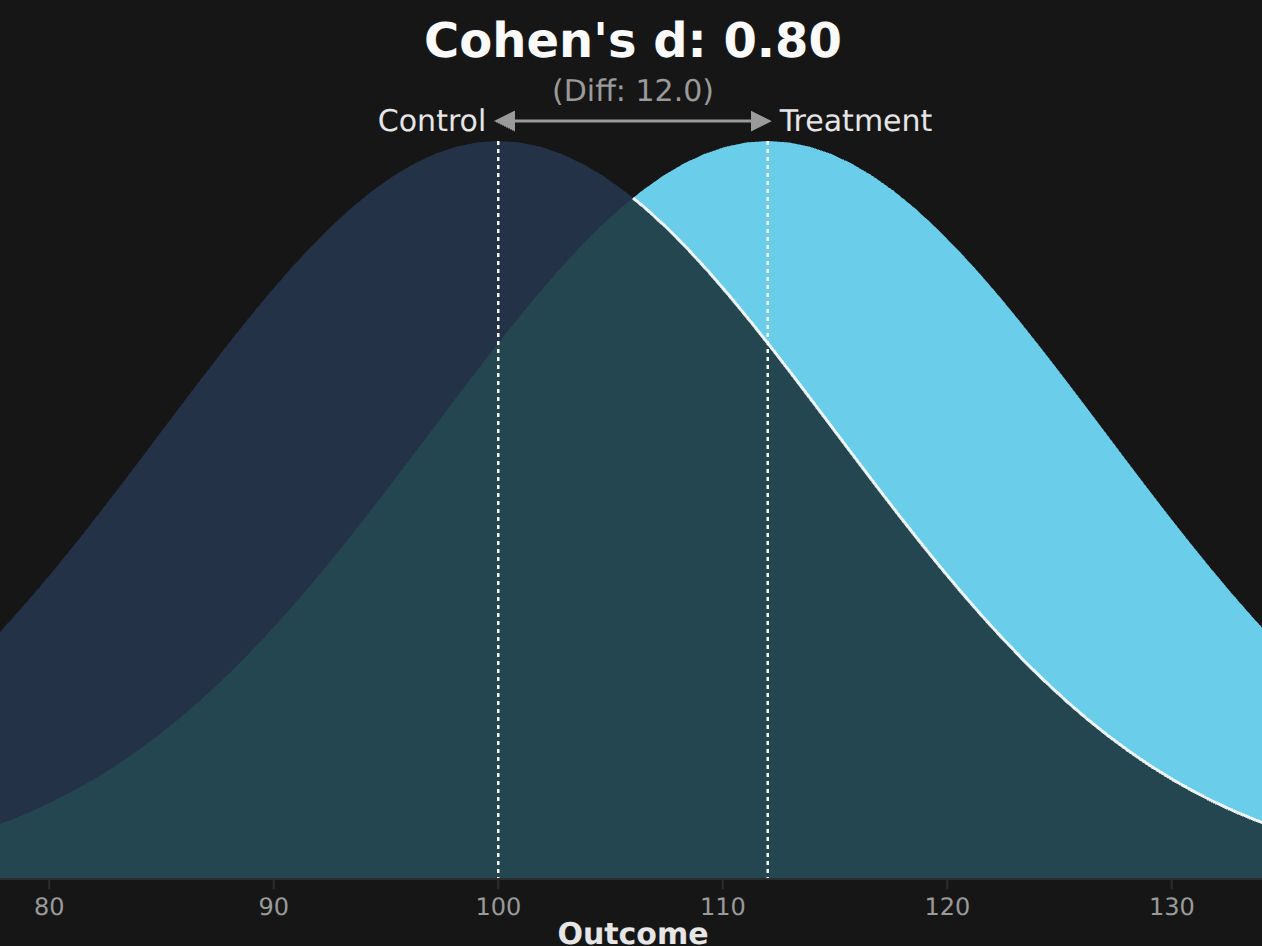
  • Cohen's d Effect size and the overlap between two distributions.
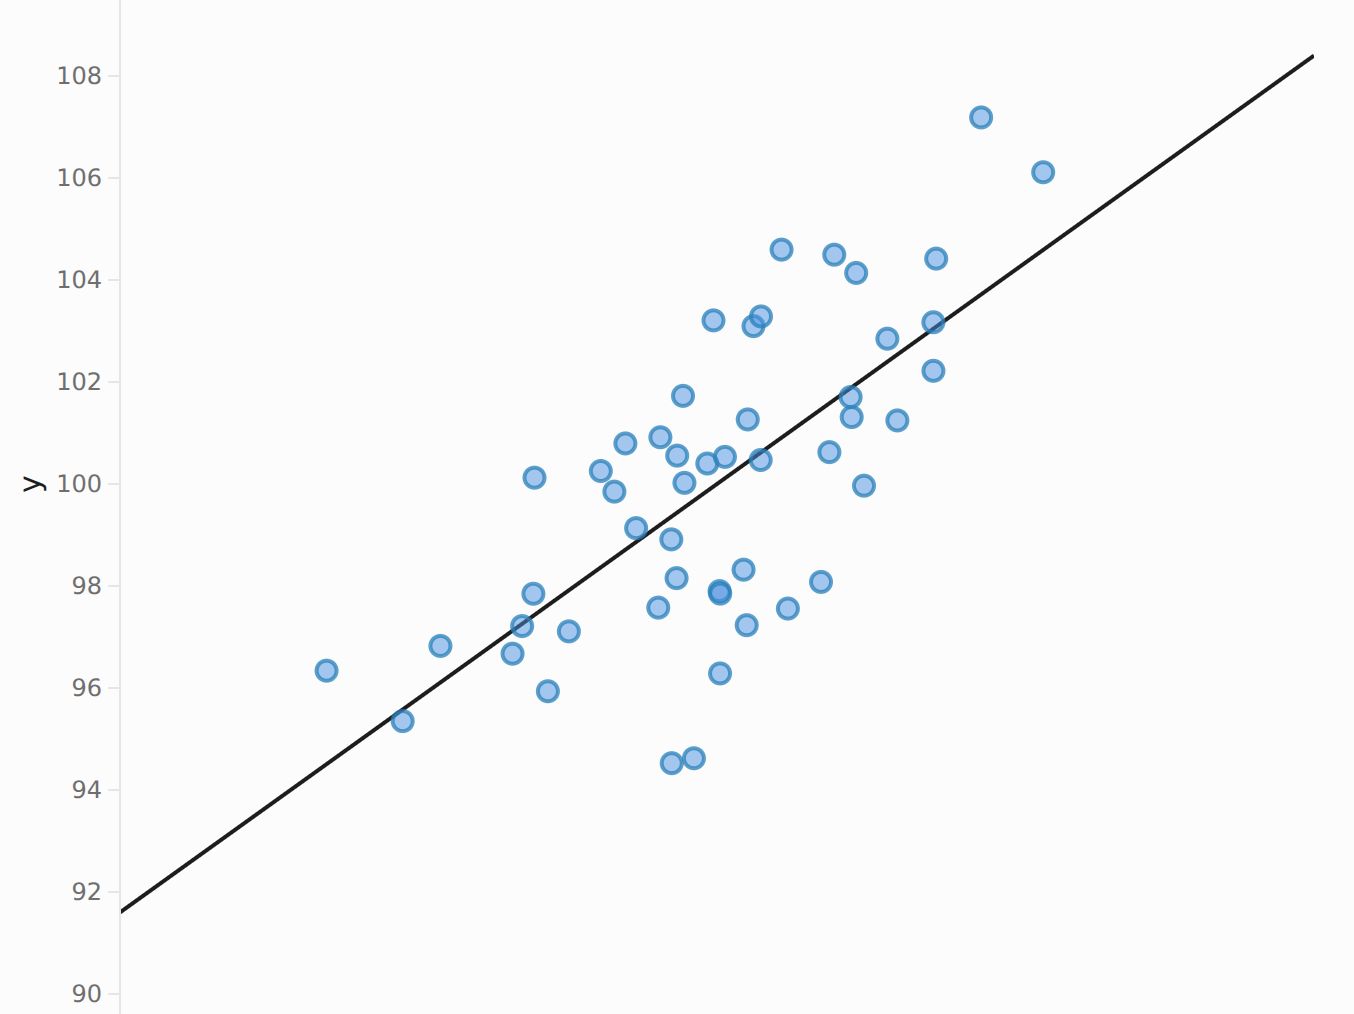
  • Correlation What a correlation coefficient looks like as a scatter.
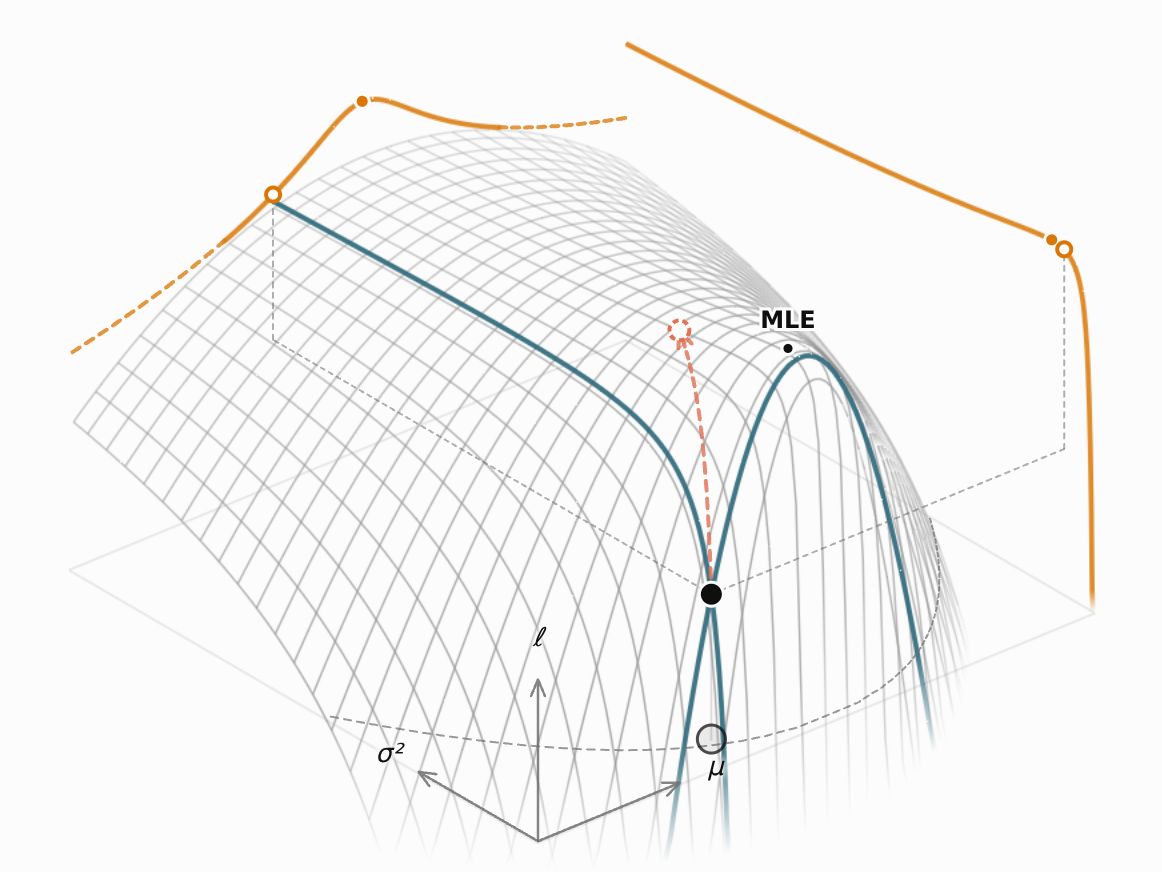
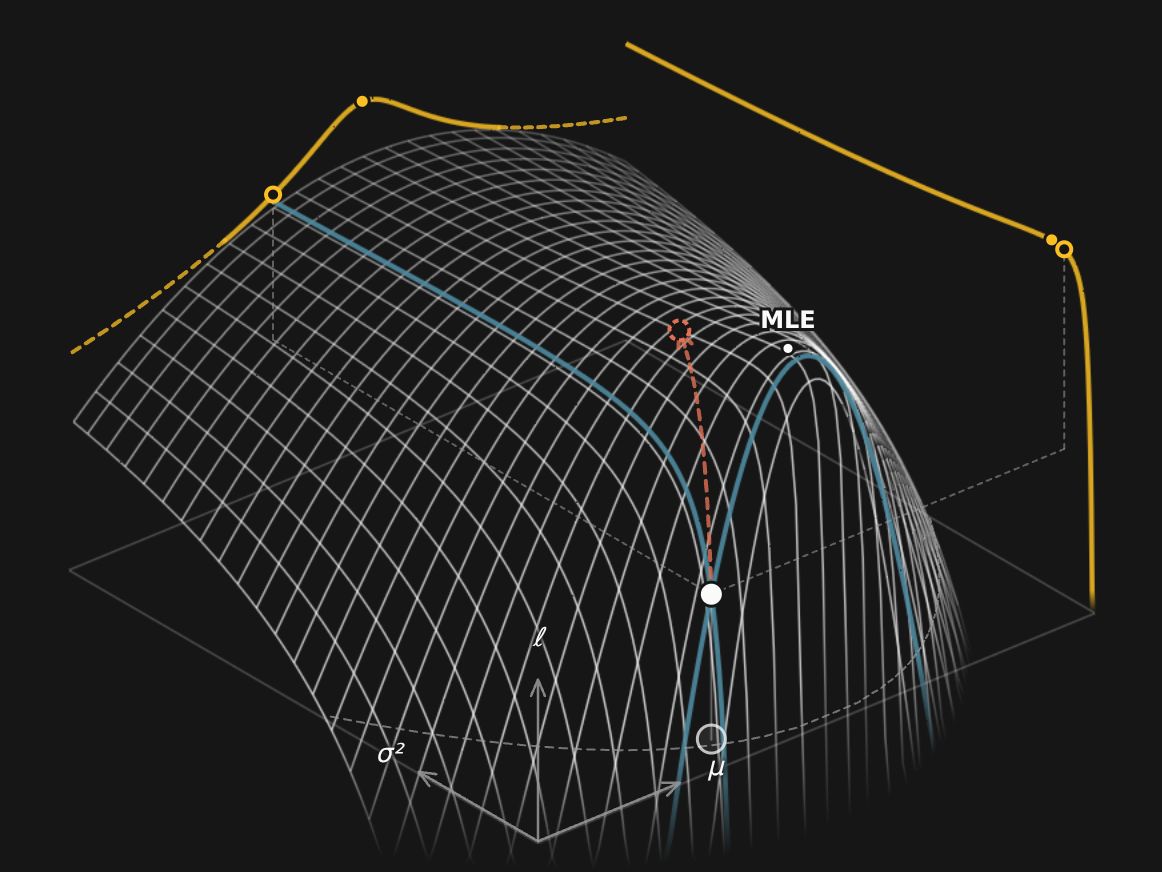
  • Likelihood Maximum likelihood estimation and the likelihood ratio, Wald, and score tests.
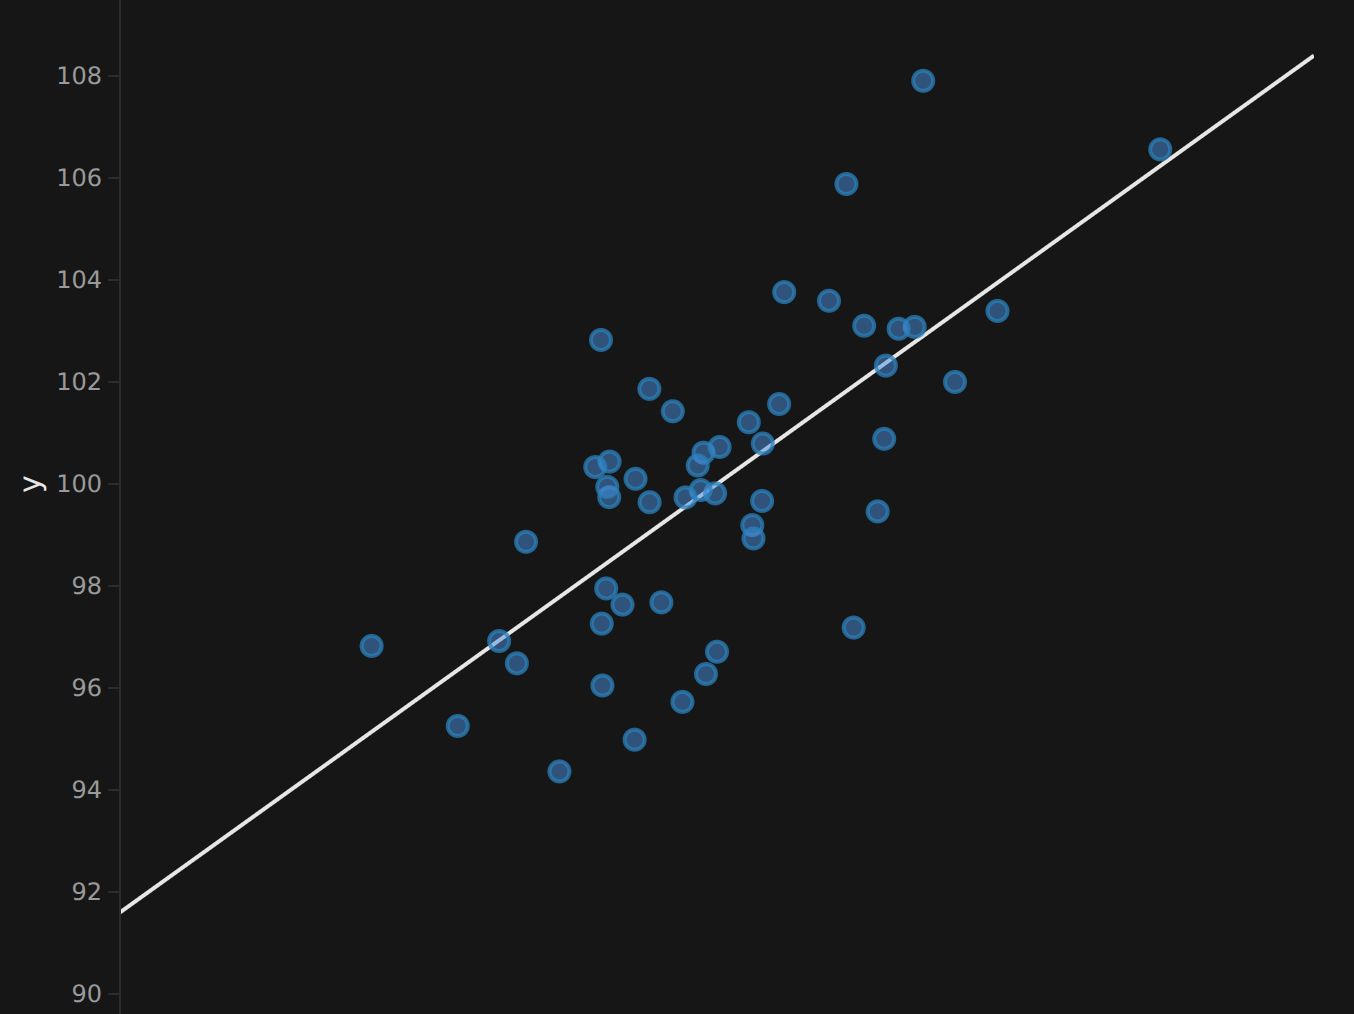
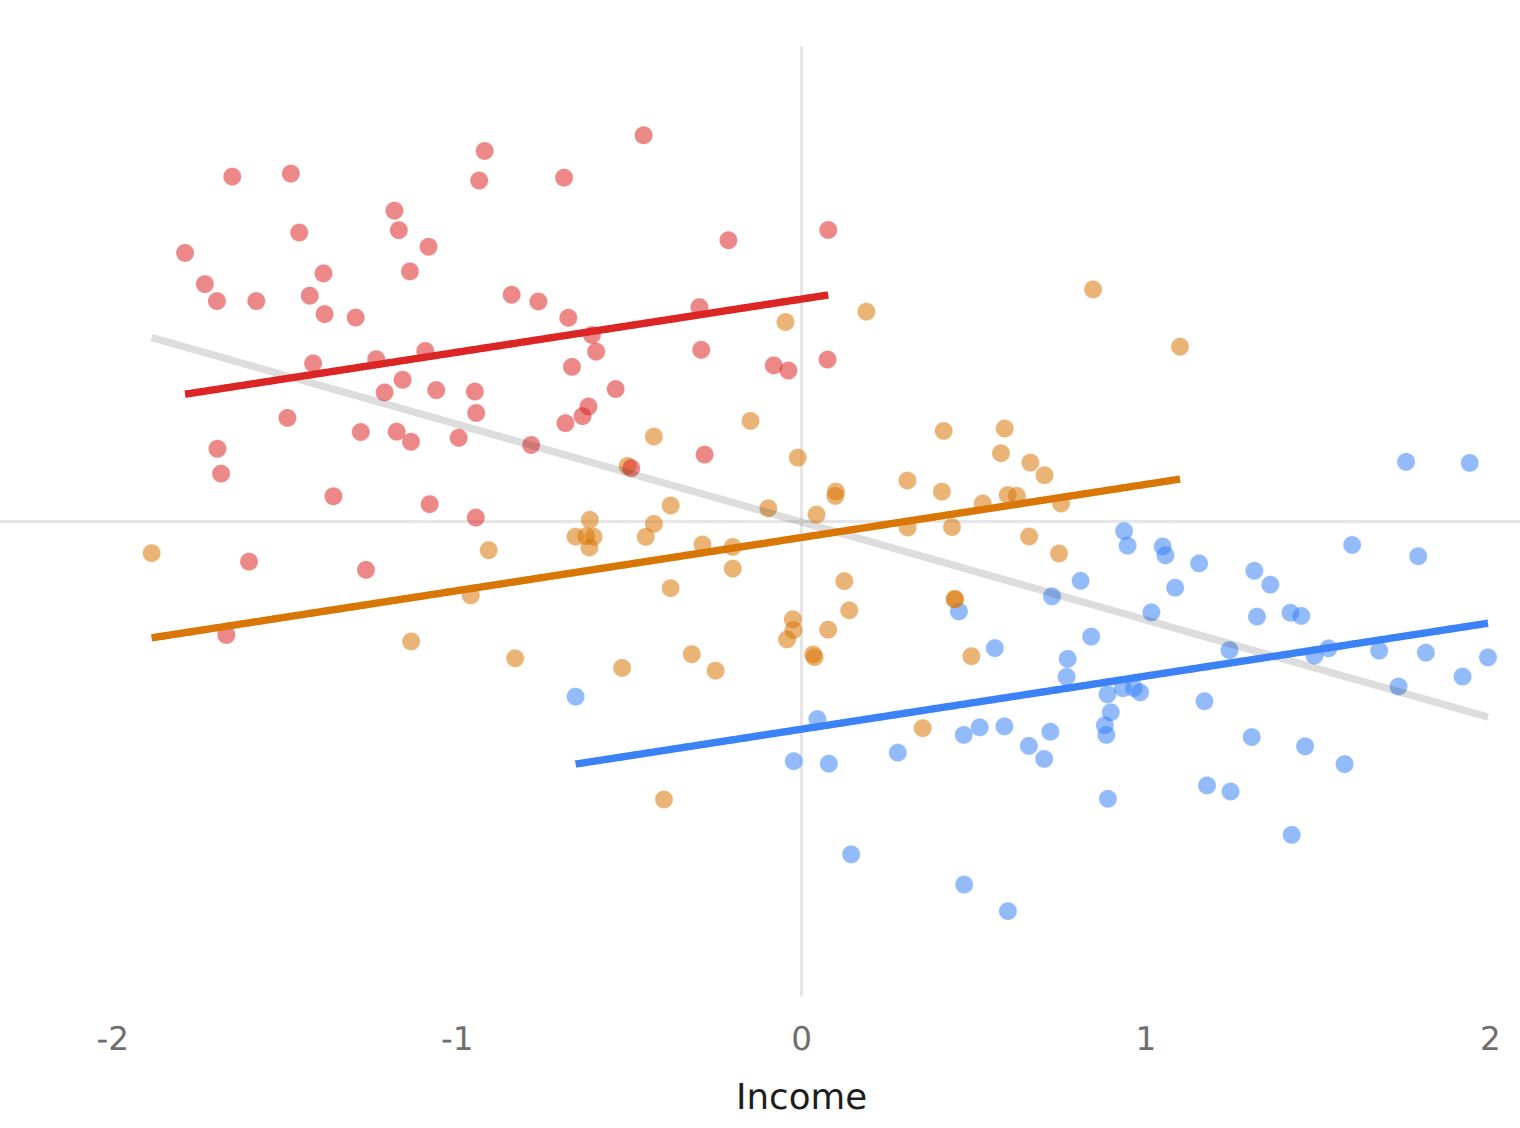
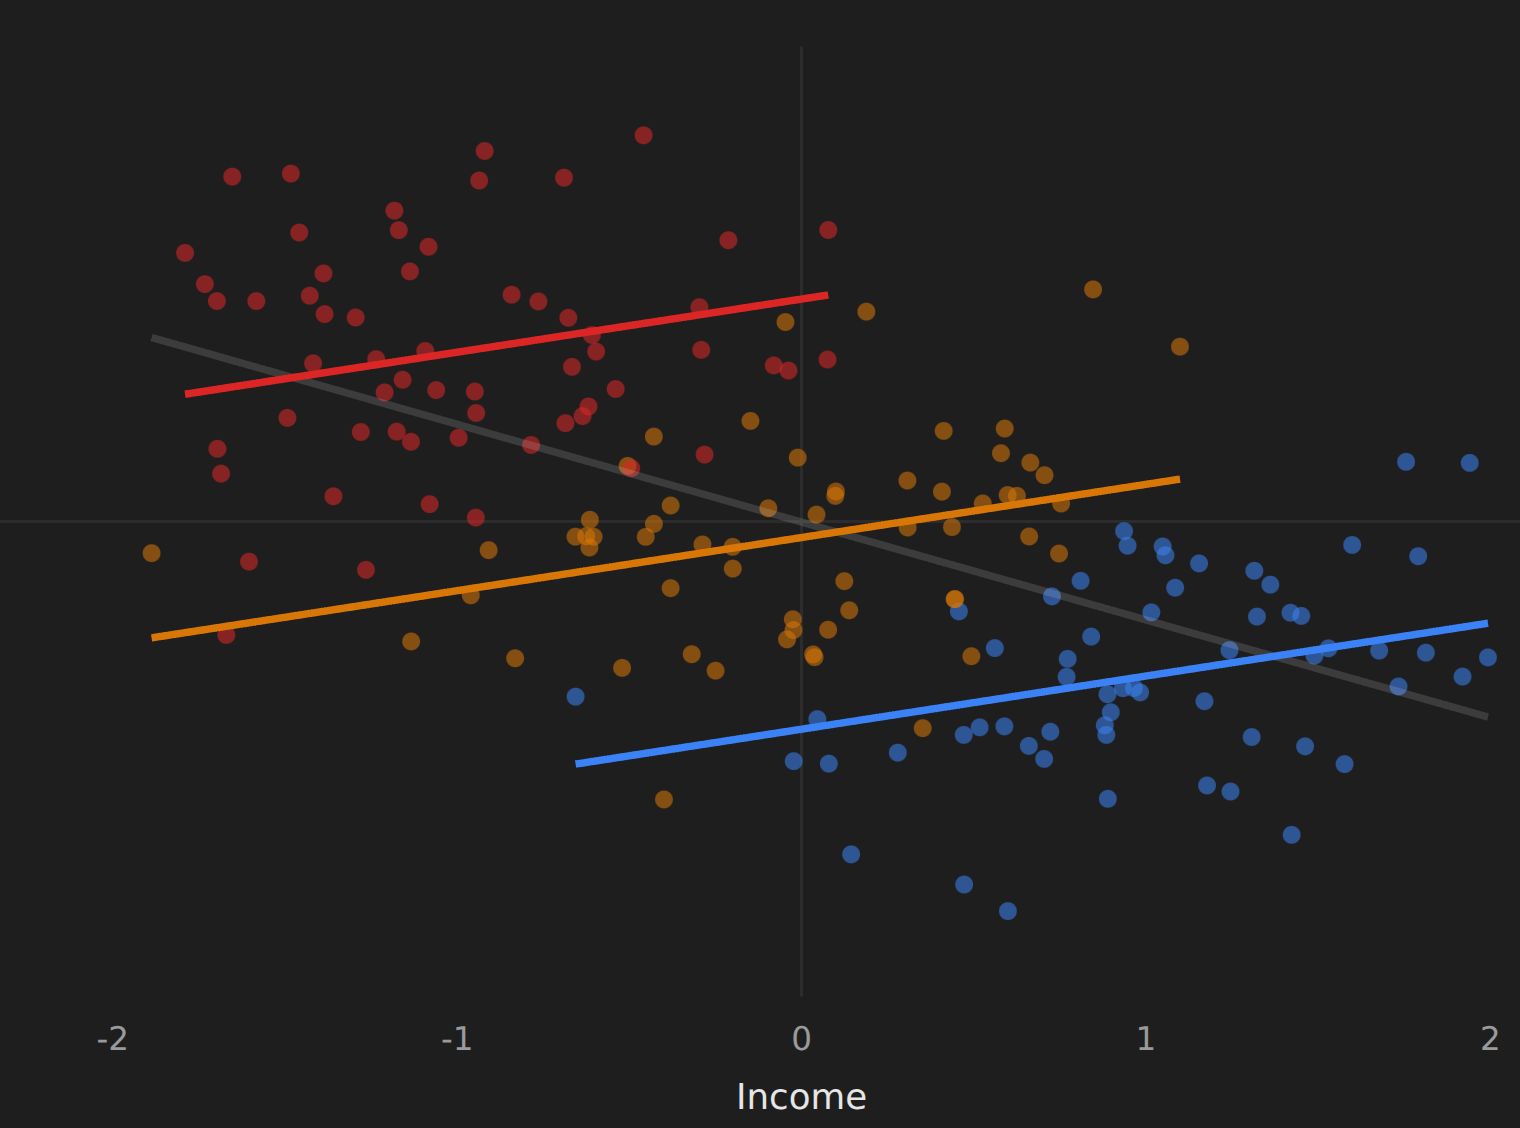
  • Adjusted coefficients Why adjusted regression coefficients are less descriptive than they look.
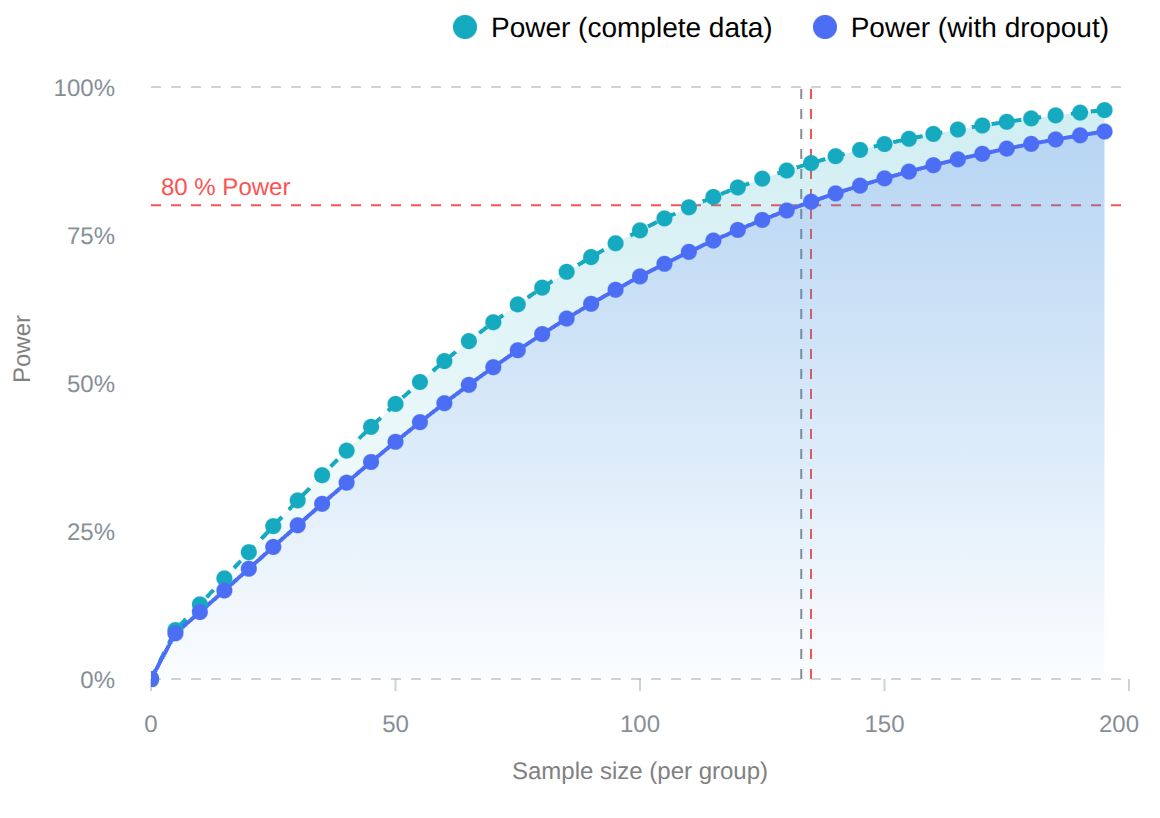
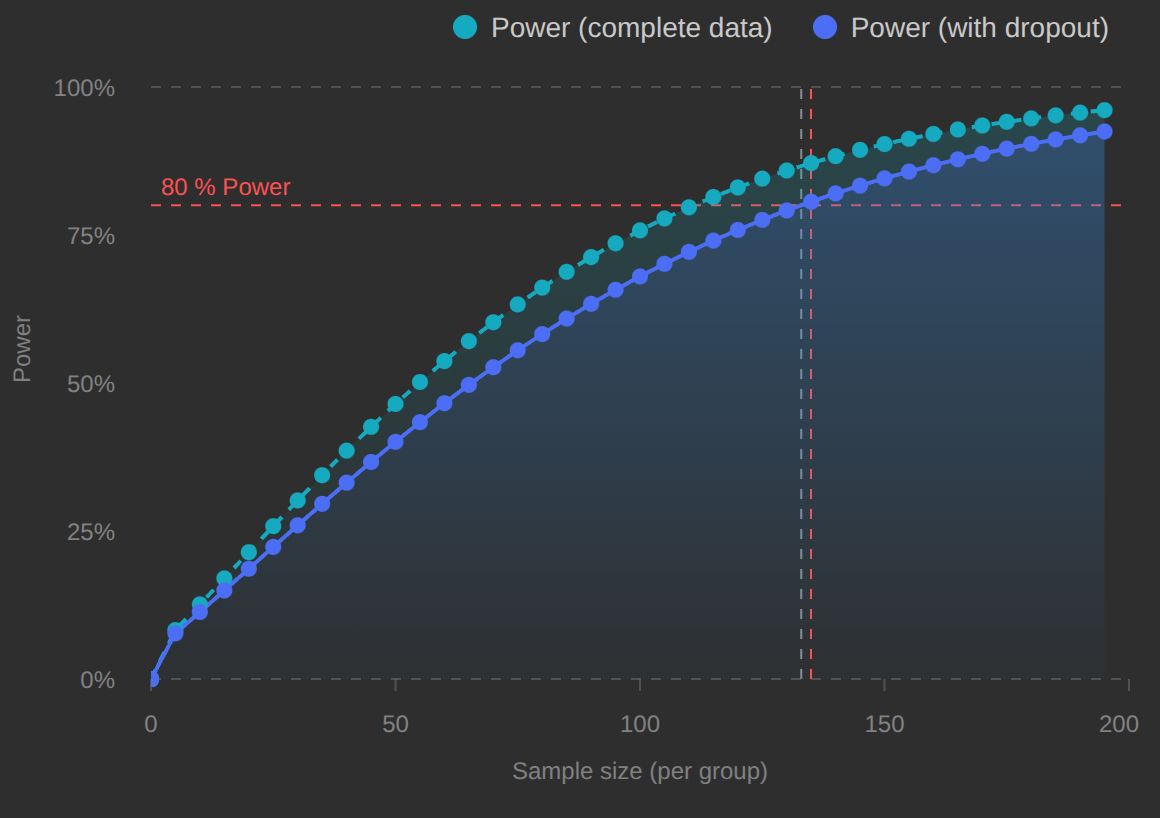
  • PowerLMM.js Sample size planning for longitudinal models with missing data.
  • p-values How p-values relate to statistical power.
  • Therapist effects How clustering by therapist shifts treatment-effect estimates.
  • Statistical power and significance testing The classic Type I and Type II error illustration, made interactive.
  • Confidence intervals Simulate confidence intervals and watch how often they cover.
  • Bayesian inference How prior and likelihood combine into the posterior.
  • Equivalence and non-inferiority testing Superiority, non-inferiority, and equivalence read off one confidence interval.
  • p-value distribution The expected distribution of p-values under different alternatives.
  • t-distribution Compare the t-distribution with the normal distribution.

Designed and built by Kristoffer Magnusson.

Connect

  • Bluesky
  • Twitter
  • GitHub
  • LinkedIn

Site

  • Posts
  • Visualizations
  • About
  • RSS
© 2026 Kristoffer Magnusson. Text content CC BY 4.0.