Interpréter la taille de l'effet par le d de Cohen
Une visualisation interactive
Créée par Kristoffer Magnusson
La taille d’effet du d de Cohen est extrêmement populaire en psychologie. Cependant, son interprétation n’est pas simple et les chercheurs utilisent souvent des directives générales, telles que faible (0.2), moyenne (0.5) et importante (0.8) lorsqu’ils interprètent un effet. De plus, dans de nombreux cas, il est permis de se demander si la différence moyenne standardisée est plus facile à interpréter que la différence moyenne non-standardisée.
Dans le but d’aider à l’interprétation du d de Cohen, cette visualisation permet les représentations suivantes: le chevauchement, le U3 de Cohen, la probabilité de supériorité, le pourcentage de chevauchement et le nombre de patients nécessaires à traiter. La visualisation vous permet également de changer l’écart type et elle affiche les différences non-standardisées.
Chargement de la visualisation
U3 de Cohen
% Chevauchement
Probabilité de supériorité
Nombre de patients à traiter
Une explication simple
Avec un d de Cohen de 0.80, 78.8% du groupe "treatment" a une valeur supérieure à la moyenne du groupe "control" (U3 de Cohen), 68.9% des deux groupes se chevauchent, et il y a 71.4% de chances qu'une personne choisie au hasard dans le groupe traitement ait un score plus élevé qu'une personne choisie au hasard dans le groupe contrôle (probabilité de supériorité). De plus, dans le but d'avoir un meilleur résultat en faveur du groupe traitement, nous avons besoin d'inclure 3.5 personnes en moyenne dans le groupe traitement. Cela signifie que s'il y a 100 personnes dans chaque groupe, et nous supposons que 20 personnes ont un résultat favorable dans le groupe contrôle, alors 20 + 28.3 personnes dans le groupe traitement auront des résultats favorables.1
1Les valeurs sont des moyennes, et il est supposé que 20 (CER) du groupe contrôle auront un "résultat favorable," c'est-à-dire que leur résultat est inférieur à un seuil donné. Vous pouvez changer ce paramètre grâce au symbole 'paramètre' à droite du slider. Allez dans la section 'formules' pour plus d'informations.

Written by Kristoffer Magnusson, a researcher in clinical psychology. You should follow him on Bluesky or on Twitter.
FAQ
Comment utiliser cette visualisation ?
Changer le d de Cohen
Pour changer le d de Cohen, utiliser le Slider, ou ouvrir le panneau des paramètres. Les entrées peuvent également être contrôlées en utilisant les flèches du clavier.
Paramètres
Vous pouvez changer les paramètres suivants en cliquant sur l’icône paramètres à droite du Slider
- Paramètres
- Moyenne 1
- Moyenne 2
- Ecart type
- Ratio d’évènement en condition contrôle (CER - Control group Event Rate)
- Labels
- Axe X
- Distribution 1
- Distribution 2
- Paramètres du Slider
- Maximum
- Résolution du Slider : contrôle le pas du Slider
Enregistrer les paramètres
Les paramètres peuvent être enregistrés dans le stockage local de votre navigateur et rester présents à chaque visite.
Axes et échelles
Vous pouvez bouger l’axe X en cliquant dessus et en glissant la souris. Un Double-clic sur la visualisation permet de centrer et de réinitialiser l’échelle.
Utilisation hors-ligne
Le site utilise un Service Worker et fonctionne même hors-ligne.
Quelles sont les formules ?
d de Cohen
Le d de Cohen est simplement la différence standardisée des moyennes,
,
où est le paramètre de population du d de Cohen. Il est supposé que que , c’est-à-dire que les variances des populations sont homogènes. Enfin, est la moyenne respective de chaque population.
Le U3 de Cohen
Cohen (1977) a défini le U3 comme la mesure du non-chevauchement, lorsque “l’on prend le pourcentage de la population A qui est inférieure à la moitié supérieure de la population B”. Le d de Cohen peut être converti en U3 de Cohen en utilisant la formule suivante
où est la distribution de répartition (ou fonction de distribution cumulative) de la distribution normale standard, et la population du d de Cohen.
Chevauchement
Généralement appelé coefficient de chevauchement (overlapping coefficient (OVL) en anglais). Le d de Cohen peut être converti en OVL en utilisant la formule suivante (Reiser et Faraggi, 1999)
où est la distribution de répartition de la distribution normale standard, et la population du d de Cohen.
Probabilité de supériorité
C’est la taille d’effet, avec de nombreux noms : taille d’effet en langage commun (LC), aire sous la fonction d’efficacité du récepteur (AUC), ou simplement A pour ces versions non-paramétriques (Ruscio et Mullen, 2012). Il se veut plus intuitif pour les personnes sans aucune formation statistique. La taille de l’effet donne la probabilité qu’une personne choisie au hasard dans le groupe traitement ait un score plus élevé qu’une personne prise au hasard dans le groupe contrôle. Le d de Cohen peut être converti en LC en utilisant la formule suivante :
où est la distribution de répartition de la distribution normale standard, et la population du d de Cohen.
Nombre de patients à traiter (NNT)
NNT est le nombre de patients que nous devrions traiter pour atteindre un résultat plus favorable comparé au groupe contrôle. Furukawa et Leucht (2011) donnent la formule suivante pour convertir le d de Cohen en NNT :
où est la distribution de répartition de la distribution normale standard et son inverse, CER est le ratio d’évènement en condition contrôle et la population du d de Cohen. N.B. CER est fixé à 20 % dans la visualisation ci-dessus. Vous pouvez changer cette valeur grâce au bouton paramètres à droite du Slider. Les définitions d’un “évènement” ou d’une “réponse” sont arbitraires et doivent être définies comme la proportion de patients qui sont en rémission, c’est-à-dire inférieure à un seuil défini par un questionnaire standardisé. Il est possible de convertir le d de Cohen en une version du NNT qui ne prend pas en compte le ratio d’évènement du groupe contrôle. Le lecteur interessé doit regarder la publication de Furukawa et Leucht (2011) qui donne un argument convaincant et montre pourquoi cela complique l’interprétation du NNT.
Code R pour calculer le NNT depuis le d de Cohen
Puisque j’ai reçu beaucoup de demandes à propos du code R pour la formule ci-dessus, le voici :
Références
- Baguley, T. (2009). Standardized or simple effect size: what should be reported? British journal of psychology, 100(Pt 3), 603–17.
- Cohen, J. (1977). Statistical power analysis for the behavioral sciencies. Routledge.
- Furukawa, T. A., & Leucht, S. (2011). How to obtain NNT from Cohen’s d: comparison of two methods. PloS one, 6(4).
- Reiser, B., & Faraggi, D. (1999). Confidence intervals for the overlapping coefficient: the normal equal variance case. Journal of the Royal Statistical Society, 48(3), 413-418.
- Ruscio, J. (2008). A probability-based measure of effect size: robustness to base rates and other factors. Psychological methods, 13(1), 19–30.
- Ruscio, J., & Mullen, T. (2012). Confidence Intervals for the Probability of Superiority Effect Size Measure and the Area Under a Receiver Operating Characteristic Curve. Multivariate Behavioral Research, 47(2), 201–223.
Comment puis-je citer cette page ?
Citez cette page en suivant votre système de citation favori. La référence ci-dessous est automatiquement générée et contient les informations correctes.
APA 7
Magnusson, K. (2023). A Causal Inference Perspective on Therapist Effects. PsyArXiv. https://DOI
BibTex
J'ai trouvé un bug / une erreur / une coquille ou je veux faire une suggestion !
Vous pouvez rapporter les erreurs ou les suggestions en ouvrant une discussion sur GitHub. Vous pouvez aussi poser une question sur les discussions GitHub.
Je vais demander à un nombre important d'étudiants de visiter votre site, est-ce que cela va faire crasher vos serveurs?
Non, cela ne pose pas de problème. L’application est exécutée dans votre navigateur, le serveur a simplement besoin de délivrer les fichiers.
La statistique de chevauchement diffère des calculs de Cohen
C’est intentionnel, vous pouvez en apprendre plus sur les raisons dans cet article de blog : Where Cohen went wrong – the proportion of overlap between two normal distributions
Est-ce que je peux inclure cette visualisation dans un livre / article / etc ?
Oui, bien sûr ! Je n’ai pas inventé le fait de tracer deux distributions Gaussiennes qui se chevauchent. Cette visualisation est dédiée au domaine public, ce qui signifie que “vous pouvez copier, modifier, distribuer et représenter l’oeuvre, même à des fins commerciales, sans avoir besoin de demander l’autorisation” (voir la Licence CC0 Creative Commons). Bien que l’attribution ne soit pas requise, elle est toujours appréciée !
Le code source pour cette page est sous licence MIT, les textes sur la page sont CC-BY 4.0.
Contribuer / Faire un don
Il y a plusieurs manières de contribuer aux logiciels libres d'accès et gratuits. Si vous aimez et voulez soutenir mon travail, vous pouvez :
Un énorme merci aux 175 sponsors qui m'ont acheté 422 cafés !
Steffen a acheté ☕☕☕☕☕☕☕☕☕☕☕☕ (12) cafés
I love your visualizations. Some of the best out there!!!
Jason Rinaldo a acheté ☕☕☕☕☕☕☕☕☕☕ (10) cafés
I've been looking for applets that show this for YEARS, for demonstrations for classes. Thank you so much! Students do not need to tolarate my whiteboard scrawl now. I'm sure they'd appreciate you, too.l
Shawn Bergman a acheté ☕☕☕☕☕ (5) cafés
Thank you for putting this together! I am using these visuals and this information to teach my Advanced Quant class.
anthonystevendick@gmail.com a acheté ☕☕☕☕☕ (5) cafés
I've been using a lot of your ideas in a paper I'm writing and even borrowed some of your code (cited of course). But this site has been so helpful I think, in addition, I owe you a few coffees!
Chip Reichardt a acheté ☕☕☕☕☕ (5) cafés
Hi Krisoffer, these are great applets and I've examined many. I'm writing a chapter for the second edition of "Teaching statistics and quantitative methods in the 21st century" by Joe Rodgers (Routledge). My chapter is on the use of applets in teaching statistics. I could well be describing 5 of yours. Would you permit me to publish one or more screen shots of the output from one or more of your applets. I promise I will be saying very positive things about your applets. If you are inclined to respond, my email address if Chip.Reichardt@du.edu.
Someone a acheté ☕☕☕☕☕ (5) cafés
Someone a acheté ☕☕☕☕☕ (5) cafés
Nice work! Saw some of your other publications and they are also really intriguing. Thanks so much!
JDMM a acheté ☕☕☕☕☕ (5) cafés
You finally helped me understand correlation! Many, many thanks... 😄
@VicCazares a acheté ☕☕☕☕☕ (5) cafés
Good stuff! It's been so helpful for teaching a Psych Stats class. Cheers!
Dustin M. Burt a acheté ☕☕☕☕☕ (5) cafés
Excellent and informative visualizations!
Someone a acheté ☕☕☕☕☕ (5) cafés
@metzpsych a acheté ☕☕☕☕☕ (5) cafés
Always the clearest, loveliest simulations for complex concepts. Amazing resource for teaching intro stats!
Ryo a acheté ☕☕☕☕☕ (5) cafés
For a couple years now I've been wanting to create visualizations like these as a way to commit these foundational concepts to memory. But after finding your website I'm both relieved that I don't have to do that now and pissed off that I couldn't create anything half as beautiful and informative as you have done here. Wonderful job.
Diarmuid Harvey a acheté ☕☕☕☕☕ (5) cafés
You have an extremely useful site with very accessible content that I have been using to introduce colleagues and students to some of the core concepts of statistics. Keep up the good work, and thanks!
Michael Hansen a acheté ☕☕☕☕☕ (5) cafés
Keep up the good work!
Michael Villanueva a acheté ☕☕☕☕☕ (5) cafés
I wish I could learn more from you about stats and math -- you use language in places that I do not understand. Cohen's D visualizations opened my understanding. Thank you
Someone a acheté ☕☕☕☕☕ (5) cafés
Thank you, Kristoffer
Pål from Norway a acheté ☕☕☕☕☕ (5) cafés
Great webpage, I use it to illustrate several issues when I have a lecture in research methods. Thanks, it is really helpful for the students:)
@MAgrochao a acheté ☕☕☕☕☕ (5) cafés
Joseph Bulbulia a acheté ☕☕☕☕☕ (5) cafés
Hard to overstate the importance of this work Kristoffer. Grateful for all you are doing.
@TDmyersMT a acheté ☕☕☕☕☕ (5) cafés
Some really useful simulations, great teaching resources.
@lakens a acheté ☕☕☕☕☕ (5) cafés
Thanks for fixing the bug yesterday!
@LinneaGandhi a acheté ☕☕☕☕☕ (5) cafés
This is awesome! Thank you for creating these. Definitely using for my students, and me! :-)
@ICH8412 a acheté ☕☕☕☕☕ (5) cafés
very useful for my students I guess
@KelvinEJones a acheté ☕☕☕☕☕ (5) cafés
Preparing my Master's student for final oral exam and stumbled on your site. We are discussing in lab meeting today. Coffee for everyone.
Someone a acheté ☕☕☕☕☕ (5) cafés
What a great site
@Daniel_Brad4d a acheté ☕☕☕☕☕ (5) cafés
Wonderful work!
David Loschelder a acheté ☕☕☕☕☕ (5) cafés
Terrific work. So very helpful. Thank you very much.
@neilmeigh a acheté ☕☕☕☕☕ (5) cafés
I am so grateful for your page and can't thank you enough!
@giladfeldman a acheté ☕☕☕☕☕ (5) cafés
Wonderful work, I use it every semester and it really helps the students (and me) understand things better. Keep going strong.
Dean Norris a acheté ☕☕☕☕☕ (5) cafés
Sal a acheté ☕☕☕☕☕ (5) cafés
Really super useful, especially for teaching. Thanks for this!
dde@paxis.org a acheté ☕☕☕☕☕ (5) cafés
Very helpful to helping teach teachers about the effects of the Good Behavior Game
@akreutzer82 a acheté ☕☕☕☕☕ (5) cafés
Amazing visualizations! Thank you!
@rdh_CLE a acheté ☕☕☕☕☕ (5) cafés
So good!
tchipman1@gsu.edu a acheté ☕☕☕ (3) cafés
Hey, your stuff is cool - thanks for the visual
Hugo Quené a acheté ☕☕☕ (3) cafés
Hi Kristoffer, Some time ago I've come up with a similar illustration about CIs as you have produced, and I'm now also referring to your work:<br>https://hugoquene.github.io/QMS-EN/ch-testing.html#sec:t-confidenceinterval-mean<br>With kind regards, Hugo Quené<br>(Utrecht University, Netherlands)
Tor a acheté ☕☕☕ (3) cafés
Thanks so much for helping me understand these methods!
Amanda Sharples a acheté ☕☕☕ (3) cafés
Soyol a acheté ☕☕☕ (3) cafés
Someone a acheté ☕☕☕ (3) cafés
Kenneth Nilsson a acheté ☕☕☕ (3) cafés
Keep up the splendid work!
@jeremywilmer a acheté ☕☕☕ (3) cafés
Love this website; use it all the time in my teaching and research.
Someone a acheté ☕☕☕ (3) cafés
Powerlmm was really helpful, and I appreciate your time in putting such an amazing resource together!
DR AMANDA C DE C WILLIAMS a acheté ☕☕☕ (3) cafés
This is very helpful, for my work and for teaching and supervising
Georgios Halkias a acheté ☕☕☕ (3) cafés
Regina a acheté ☕☕☕ (3) cafés
Love your visualizations!
Susan Evans a acheté ☕☕☕ (3) cafés
Thanks. I really love the simplicity of your sliders. Thanks!!
@MichaMarie8 a acheté ☕☕☕ (3) cafés
Thanks for making this Interpreting Correlations: Interactive Visualizations site - it's definitely a great help for this psych student! 😃
Zakaria Giunashvili, from Georgia a acheté ☕☕☕ (3) cafés
brilliant simulations that can be effectively used in training
Someone a acheté ☕☕☕ (3) cafés
@PhysioSven a acheté ☕☕☕ (3) cafés
Amazing illustrations, there is not enough coffee in the world for enthusiasts like you! Thanks!
Cheryl@CurtinUniAus a acheté ☕☕☕ (3) cafés
🌟What a great contribution - thanks Kristoffer!
vanessa moran a acheté ☕☕☕ (3) cafés
Wow - your website is fantastic, thank you for making it.
Someone a acheté ☕☕☕ (3) cafés
mikhail.saltychev@gmail.com a acheté ☕☕☕ (3) cafés
Thank you Kristoffer This is a nice site, which I have been used for a while. Best Prof. Mikhail Saltychev (Turku University, Finland)
Someone a acheté ☕☕☕ (3) cafés
Ruslan Klymentiev a acheté ☕☕☕ (3) cafés
@lkizbok a acheté ☕☕☕ (3) cafés
Keep up the nice work, thank you!
@TELLlab a acheté ☕☕☕ (3) cafés
Thanks - this will help me to teach tomorrow!
SCCT/Psychology a acheté ☕☕☕ (3) cafés
Keep the visualizations coming!
@elena_bolt a acheté ☕☕☕ (3) cafés
Thank you so much for your work, Kristoffer. I use your visualizations to explain concepts to my tutoring students and they are a huge help.
A random user a acheté ☕☕☕ (3) cafés
Thank you for making such useful and pretty tools. It not only helped me understand more about power, effect size, etc, but also made my quanti-method class more engaging and interesting. Thank you and wish you a great 2021!
@hertzpodcast a acheté ☕☕☕ (3) cafés
We've mentioned your work a few times on our podcast and we recently sent a poster to a listener as prize so we wanted to buy you a few coffees. Thanks for the great work that you do!Dan Quintana and James Heathers - Co-hosts of Everything Hertz
Cameron Proctor a acheté ☕☕☕ (3) cafés
Used your vizualization in class today. Thanks!
eshulman@brocku.ca a acheté ☕☕☕ (3) cafés
My students love these visualizations and so do I! Thanks for helping me make stats more intuitive.
Someone a acheté ☕☕☕ (3) cafés
Adrian Helgå Vestøl a acheté ☕☕☕ (3) cafés
@misteryosupjoo a acheté ☕☕☕ (3) cafés
For a high school teacher of psychology, I would be lost without your visualizations. The ability to interact and manipulate allows students to get it in a very sticky manner. Thank you!!!
Chi a acheté ☕☕☕ (3) cafés
You Cohen's d post really helped me explaining the interpretation to people who don't know stats! Thank you!
Someone a acheté ☕☕☕ (3) cafés
You doing useful work !! thanks !!
@ArtisanalANN a acheté ☕☕☕ (3) cafés
Enjoy.
@jsholtes a acheté ☕☕☕ (3) cafés
Teaching stats to civil engineer undergrads (first time teaching for me, first time for most of them too) and grasping for some good explanations of hypothesis testing, power, and CI's. Love these interactive graphics!
@notawful a acheté ☕☕☕ (3) cafés
Thank you for using your stats and programming gifts in such a useful, generous manner. -Jess
Mateu Servera a acheté ☕☕☕ (3) cafés
A job that must have cost far more coffees than we can afford you ;-). Thank you.
@cdrawn a acheté ☕☕☕ (3) cafés
Thank you! Such a great resource for teaching these concepts, especially CI, Power, correlation.
Julia a acheté ☕☕☕ (3) cafés
Fantastic work with the visualizations!
@felixthoemmes a acheté ☕☕☕ (3) cafés
@dalejbarr a acheté ☕☕☕ (3) cafés
Your work is amazing! I use your visualizations often in my teaching. Thank you.
@PsychoMouse a acheté ☕☕☕ (3) cafés
Excellent! Well done! SOOOO Useful!😊 🐭
Someone a acheté ☕☕ (2) cafés
Thanks, your work is great!!
Dan Sanes a acheté ☕☕ (2) cafés
this is a superb, intuitive teaching tool!
@whlevine a acheté ☕☕ (2) cafés
Thank you so much for these amazing visualizations. They're a great teaching tool and the allow me to show students things that it would take me weeks or months to program myself.
Someone a acheté ☕☕ (2) cafés
@notawful a acheté ☕☕ (2) cafés
Thank you for sharing your visualization skills with the rest of us! I use them frequently when teaching intro stats.
Someone a acheté ☕ (1) café
You are awesome
Thom Marchbank a acheté ☕ (1) café
Your visualisations are so useful! Thank you so much for your work.
georgina g. a acheté ☕ (1) café
thanks for helping me in my psych degree!
Someone a acheté ☕ (1) café
Thank You for this work.
Kosaku Noba a acheté ☕ (1) café
Nice visualization, I bought a cup of coffee.
Someone a acheté ☕ (1) café
Thomas a acheté ☕ (1) café
Great. Use it for teaching in psychology.
Someone a acheté ☕ (1) café
It is the best statistics visualization so far!
Ergun Pascu a acheté ☕ (1) café
AMAZING Tool!!! Thank You!
Ann Calhoun-Sauls a acheté ☕ (1) café
This has been a wonderful resource for my statistics and research methods classes. I also occassionally use it for other courses such as Theories of Personality and Social Psychology
David Britt a acheté ☕ (1) café
nicely reasoned
Mike a acheté ☕ (1) café
I appreciate your making this site available. Statistics are not in my wheelhouse, but the ability to display my data more meaningfully in my statistics class is both educational and visually appealing. Thank you!
Jayne T Jacobs a acheté ☕ (1) café
Andrew J O'Neill a acheté ☕ (1) café
Thanks for helping understand stuff!
Someone a acheté ☕ (1) café
Someone a acheté ☕ (1) café
Shawn Hemelstrand a acheté ☕ (1) café
Thank you for this great visual. I use it all the time to demonstrate Cohen's d and why mean differences affect it's approximation.
Adele Fowler-Davis a acheté ☕ (1) café
Thank you so much for your excellent post on longitudinal models. Keep up the good work!
Stewart a acheté ☕ (1) café
This tool is awesome!
Someone a acheté ☕ (1) café
Aidan Nelson a acheté ☕ (1) café
Such an awesome page, Thank you
Someone a acheté ☕ (1) café
Ellen Kearns a acheté ☕ (1) café
Dr Nazam Hussain a acheté ☕ (1) café
Someone a acheté ☕ (1) café
Eva a acheté ☕ (1) café
I've been learning about power analysis and effect sizes (trying to decide on effect sizes for my planned study to calculate sample size) and your Cohen's d interactive tool is incredibly useful for understanding the implications of different effect sizes!
Someone a acheté ☕ (1) café
Someone a acheté ☕ (1) café
Thanks a lot!
Someone a acheté ☕ (1) café
Reena Murmu Nielsen a acheté ☕ (1) café
Tony Andrea a acheté ☕ (1) café
Thanks mate
Tzao a acheté ☕ (1) café
Thank you, this really helps as I am a stats idiot :)
Melanie Pflaum a acheté ☕ (1) café
Sacha Elms a acheté ☕ (1) café
Yihan Xu a acheté ☕ (1) café
Really appreciate your good work!
@stevenleung a acheté ☕ (1) café
Your visualizations really help me understand the math.
Junhan Chen a acheté ☕ (1) café
Someone a acheté ☕ (1) café
Someone a acheté ☕ (1) café
Michael Hansen a acheté ☕ (1) café
ALEXANDER VIETHEER a acheté ☕ (1) café
mather a acheté ☕ (1) café
Someone a acheté ☕ (1) café
Bastian Jaeger a acheté ☕ (1) café
Thanks for making the poster designs OA, I just hung two in my office and they look great!
@ValerioVillani a acheté ☕ (1) café
Thanks for your work.
Someone a acheté ☕ (1) café
Great work!
@YashvinSeetahul a acheté ☕ (1) café
Someone a acheté ☕ (1) café
Angela a acheté ☕ (1) café
Thank you for building such excellent ways to convey difficult topics to students!
@inthelabagain a acheté ☕ (1) café
Really wonderful visuals, and such a fantastic and effective teaching tool. So many thanks!
Someone a acheté ☕ (1) café
Someone a acheté ☕ (1) café
Yashashree Panda a acheté ☕ (1) café
I really like your work.
Ben a acheté ☕ (1) café
You're awesome. I have students in my intro stats class say, "I get it now," after using your tool. Thanks for making my job easier.
Gabriel Recchia a acheté ☕ (1) café
Incredibly useful tool!
Shiseida Sade Kelly Aponte a acheté ☕ (1) café
Thanks for the assistance for RSCH 8210.
@Benedikt_Hell a acheté ☕ (1) café
Great tools! Thank you very much!
Amalia Alvarez a acheté ☕ (1) café
@noelnguyen16 a acheté ☕ (1) café
Hi Kristoffer, many thanks for making all this great stuff available to the community!
Eran Barzilai a acheté ☕ (1) café
These visualizations are awesome! thank you for creating it
Someone a acheté ☕ (1) café
Chris SG a acheté ☕ (1) café
Very nice.
Gray Church a acheté ☕ (1) café
Thank you for the visualizations. They are fun and informative.
Qamar a acheté ☕ (1) café
Tanya McGhee a acheté ☕ (1) café
@schultemi a acheté ☕ (1) café
Neilo a acheté ☕ (1) café
Really helpful visualisations, thanks!
Someone a acheté ☕ (1) café
This is amazing stuff. Very slick.
Someone a acheté ☕ (1) café
Sarko a acheté ☕ (1) café
Thanks so much for creating this! Really helpful for being able to explain effect size to a clinician I'm doing an analysis for.
@DominikaSlus a acheté ☕ (1) café
Thank you! This page is super useful. I'll spread the word.
Someone a acheté ☕ (1) café
Melinda Rice a acheté ☕ (1) café
Thank you so much for creating these tools! As we face the challenge of teaching statistical concepts online, this is an invaluable resource.
@tmoldwin a acheté ☕ (1) café
Fantastic resource. I think you would be well served to have one page indexing all your visualizations, that would make it more accessible for sharing as a common resource.
Someone a acheté ☕ (1) café
Fantastic Visualizations! Amazing way to to demonstrate how n/power/beta/alpha/effect size are all interrelated - especially for visual learners! Thank you for creating this?
@jackferd a acheté ☕ (1) café
Incredible visualizations and the best power analysis software on R.
Cameron Proctor a acheté ☕ (1) café
Great website!
Someone a acheté ☕ (1) café
Hanah Chapman a acheté ☕ (1) café
Thank you for this work!!
Someone a acheté ☕ (1) café
Jayme a acheté ☕ (1) café
Nice explanation and visual guide of Cohen's d
Bart Comly Boyce a acheté ☕ (1) café
thank you
Dr. Mitchell Earleywine a acheté ☕ (1) café
This site is superb!
Florent a acheté ☕ (1) café
Zampeta a acheté ☕ (1) café
thank you for sharing your work.
Mila a acheté ☕ (1) café
Thank you for the website, made me smile AND smarter :O enjoy your coffee! :)
Deb a acheté ☕ (1) café
Struggling with statistics and your interactive diagram made me smile to see that someone cares enough about us strugglers to make a visual to help us out!😍
Someone a acheté ☕ (1) café
@exerpsysing a acheté ☕ (1) café
Much thanks! Visualizations are key to my learning style!
Someone a acheté ☕ (1) café
Sponsors
Vous pouvez sponsoriser mon travail open source en utilisant les Sponsors GitHub et avoir votre nom ici.
Investisseurs ✨❤️
Les Pull-Requests sont également bienvenus, ou vous pouvez contribuer en suggérant l'ajout de nouvelles fonctions, de références utiles, ou aider à détecter les coquilles. Démarrez simplement un sujet sur GitHub.
Plus de visualisations

PowerLMM.js
Sample size planning for longitudinal models with missing data
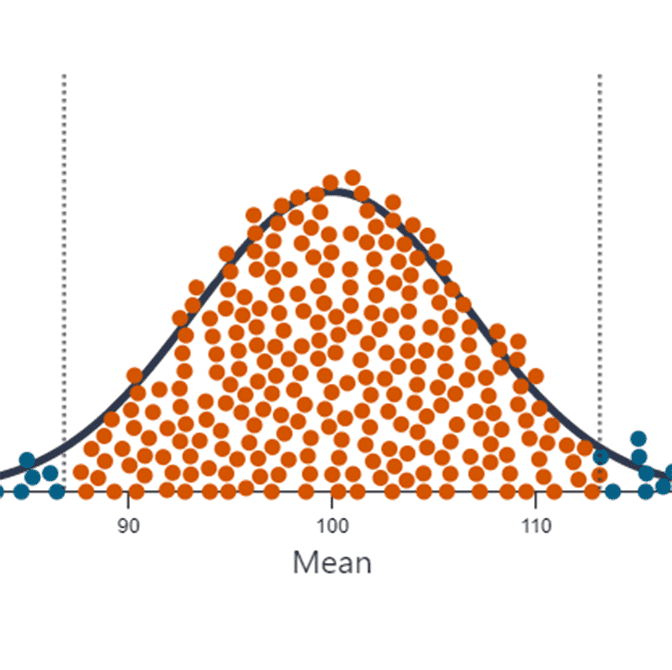
Understanding p-values Through Simulations
An interactive simulation to help explain p-values
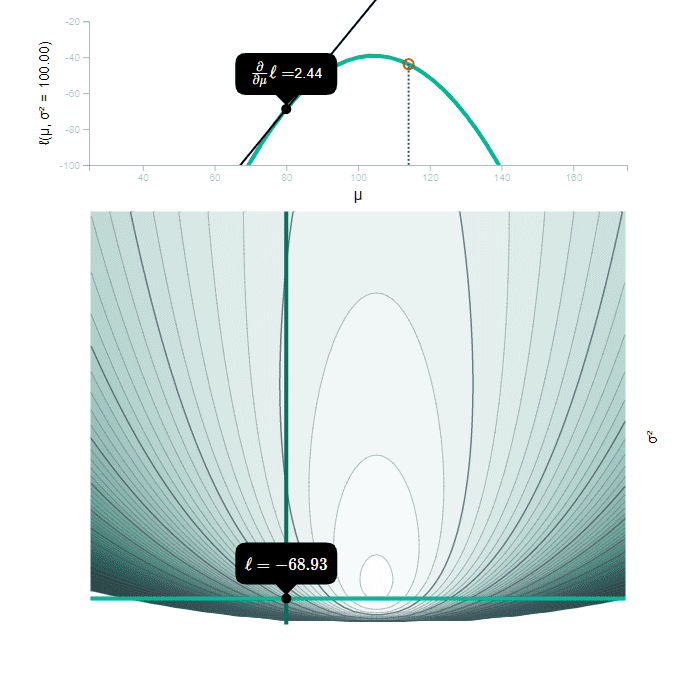
Maximum Likelihood
An interactive post covering various aspects of maximum likelihood estimation.

Cohen's d
An interactive app to visualize and understand standardized effect sizes.
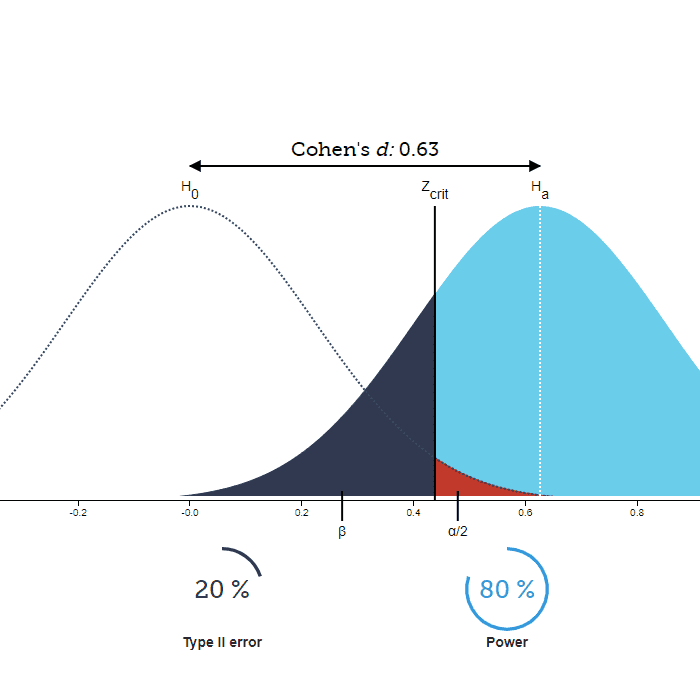
Statistical Power and Significance Testing
An interactive version of the traditional Type I and II error illustration.
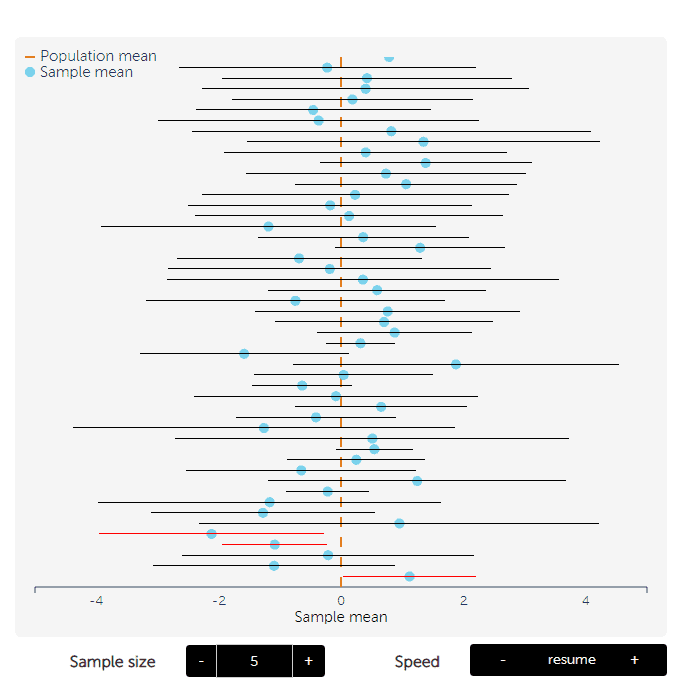
Confidence Intervals
An interactive simulation of confidence intervals
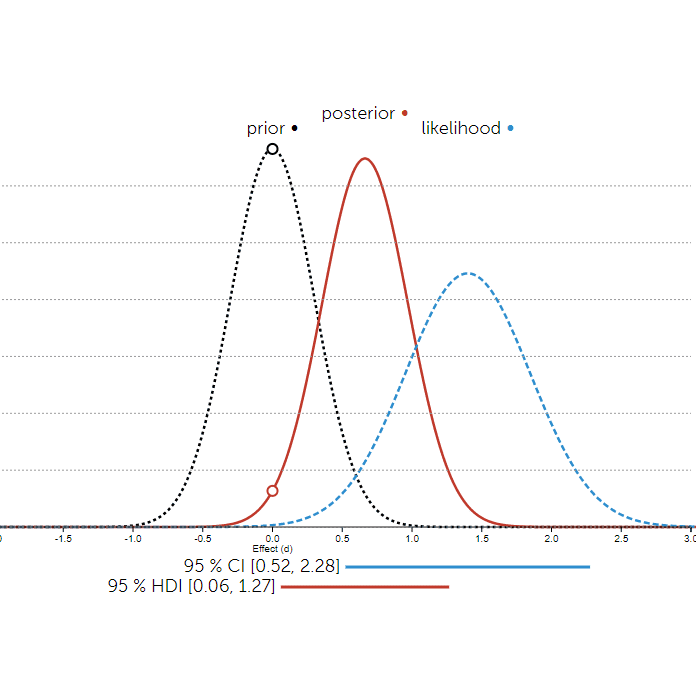
Bayesian Inference
An interactive illustration of prior, likelihood, and posterior.

Correlations
Interactive scatterplot that lets you visualize correlations of various magnitudes.

Equivalence and Non-Inferiority Testing
Explore how superiority, non-inferiority, and equivalence testing relates to a confidence interval
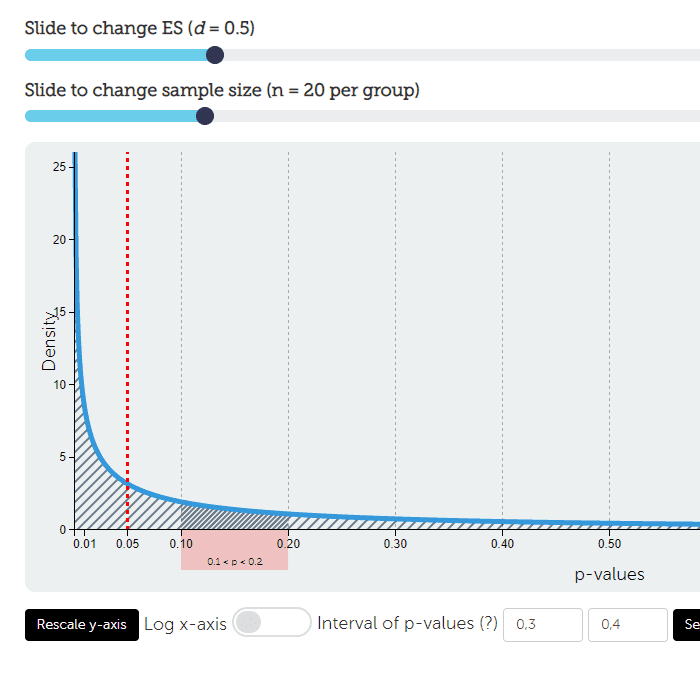
P-value distribution
Explore the expected distribution of p-values under varying alternative hypothesises.

t-distribution
Interactively compare the t- and normal distribution.