Cohen d Etki Büyüklüğünün Yorumlanması
Etkileşimli Görselleştirme Aracı
Oluşturan Kristoffer Magnusson
Cohen d etki büyüklüğü psikolojide son derece popülerdir. Ancak, yorumu basit değildir ve araştırmacılar bir etkiyi yorumlarken sıklıkla küçük (0.2), orta (0.5) ve geniş (0.8) gibi genel rehberleri kullanır. Ayrıca, birçok durumda standartlaştırılmış ortalama farkının standartlaştırılmamış ortalama farkından daha fazla yorumlanabilir olup olmadığı sorgulanabilir.
Cohen d‘nin yorumlanmasına yardımcı olmak için bu görselleştirme, Cohen d‘nin şu farklı temsillerini sunar: görsel örtüşme, Cohen U3, üstünlük olasılığı, örtüşme yüzdesi ve iyileşme için gereken kişi sayısı. Ayrıca standart sapmayı değiştirmenize olanak tanır ve standartlaştırılmamış farkı görüntüler.
Görselleştirme yükleniyor
Cohen U3
% Örtüşme
Üstünlük olasılığı
İyileşme için gereken kişi sayısı
Ortak dil açıklaması
0.80 Cohen d ile, "treatment" grubunun 78.8% değeri "control" grubunun ortalamasının üzerinde olacaktır (Cohen U3), iki grup 68.9% örtüşecek ve "treatment" grubundan rastgele seçilen bir kişinin, "control" grubundan rastgele seçilen bir kişiden daha olumlu sonuca sahip olması şansı (üstünlük olasılığı) 71.4% olacaktır. Ayrıca, "control" grubuna kıyasla "treatment" grubunda bir tane daha olumlu sonuç elde etmek için, tedavi için gerekli kişi sayısı (NNT) 3.5 ortalama bireydir. Bunun anlamı, her grupta 100 kişi varsa ve 20 kişinin "control" grubunda olumlu sonuca sahip olduğunu varsayarsak, o zaman 20 + 28.3 kişi "treatment" grubunda olumlu sonuca sahip olacaktır.1
1Değerler ortalamadır ve "control" grubunda "olumlu sonuca" sahip olanların 20 (KGO) değeri olduğu varsayılır, yani onların sonuçları belirli bir kesme puanın altında/üstünde olmalıdır. Kaydırıcının sağındaki ayarlar simgesine basarak bunu değiştirin. Daha fazla bilgi için formül bölümüne gidin.

Written by Kristoffer Magnusson, a researcher in clinical psychology. You should follow him on Bluesky or on Twitter.
FAQ
Bu görselleştirmeyi nasıl kullanabilirim?
Cohen d değiştir
Cohen d kodunu değiştirmek için kaydırıcıyı kullanın veya ayarlar sekmesini açıp parametreleri değiştirin. Girdiler klavye okları kullanılarak da kontrol edilebilir.
Ayarlar
Kaydırıcının sağındaki ayarlar simgesine tıklayarak aşağıdaki ayarları değiştirebilirsiniz.
- Parametreler
- Ortalama 1
- Ortalama 2
- Standart Sapma
- Kontrol grubu gözlem oranı (KGO)
- Etiketler
- X ekseni
- Dağılım 1
- Dağılım 2
- Kaydırıcı ayarları
- Kaydırıcı Maks
- Kaydırıcı Adımı: Kaydırıcının adım büyüklüğünü kontrol eder
Ayarları kaydet
Ayarlar, tarayıcınızın localStorage adresine kaydedilebilir ve ziyaret boyunca bu şekilde devam edecektir.
Kaydır ve yeniden ölçeklendir
Tıklayarak x eksenini kaydırabilir ve görselleştirmeyi sürükleyebilirsin. Görselleştirmeyi ortalamak ve yeniden ölçeklendirmek için çift tıklayın.
Çevrimdışı kullan
Bu site bir hizmet çalışanı kullanılarak önbelleğe alınır ve çevrimdışı olduğunuzda bile çalışır.
Formüller nedir?
Cohen d
Cohen d basitçe standartlaştırılmış ortalama farkıdır,
,
, Cohen d‘sinin popülasyon parametresidir. yani popülasyon varyanslarının homojen olduğu varsayıldığında. Ve , ilgili popülasyonun ortalamasıdır.
Cohen U3
Cohen (1977), U3‘yu bir örtüşmeme ölçüsü olarak tanımladı; burada “Β popülasyonunun vakalarının üst yarısını aştığı A popülasyonunun yüzdesini alıyoruz”. Cohen d‘si aşağıdaki formül kullanılarak Cohen U3‘ya dönüştürülebilir
burada standart normal dağılımın kümülatif dağılım işlevidir ve popülasyon Cohen d‘sidir.
Örtüşme
Genellikle örtüşme katsayısı (OVL) olarak adlandırılır. Cohen d aşağıdaki formül kullanılarak OVL’ye dönüştürülebilir (Reiser ve Faraggi, 1999)
burada standart normal dağılımın kümülatif dağılım fonksiyonudur ve popülasyon Cohen d‘sidir.
Üstünlük olasılığı
Bu, birçok isimle etki büyüklüğüdür: ortak dil etki büyüklüğü (CL), alıcı işletim karakteristiklerinin altındaki alan (AUC) veya parametrik olmayan versiyonu için basitçe A (Ruscio & Mullen, 2012). İstatistik eğitimi almamış kişiler için daha sezgisel olması amaçlanmıştır. Etki büyüklüğü, deney grubundan rastgele seçilen bir kişinin kontrol grubundan rastgele seçilen bir kişiden daha yüksek puan alma olasılığını verir. Cohen d aşağıdaki formül kullanılarak CL’ye dönüştürülebilir (Ruscio, 2008)
burada standart normal dağılımın kümülatif dağılım işlevidir ve popülasyon Cohen d‘sidir.
İyileşme için gereken kişi sayısı
NNT, kontrol grubuna kıyasla bir tane daha olumlu sonuç elde edilmesi amacıyla iyileşme için gereken kişi sayısıdır. Furukawa ve Leucht (2011), Cohen d‘yi NNT’ye dönüştürmek için aşağıdaki formülü verir.
standart normal dağılımın kümülatif dağılım fonksiyonu ve bunun tersi olduğunda, KGO kontrol grubu gözlem oranı ve popülasyon Cohen d‘sidir. N.B. Yukarıdaki görselleştirmede, KGO %20 olarak ayarlanmıştır. Kaydırıcının sağındaki ayarlar simgesine basarak değiştirebilirsiniz. Bir “olay” veya “yanıt” tanımı keyfidir ve remisyonda olan hastaların oranı olarak tanımlanabilir, örn. standart bir anketin belirli bir kesme puanının altındakiler/üstündekiler. Kontrol grubu gözlem oranından (KGO) bağımsız olarak Cohen d değerini NNT’ye dönüştürmek mümkündür. İlgilenenler, bunun NNT’nin yorumlanmasını neden karmaşık hale getirdiğine dair ikna edici bir argümanın verildiği Furukawa ve Leucht (2011) kaynağına bakmalıdır.
Cohen d‘den NNT’yi hesaplamak için R kodu
Birçoğu yukarıdaki formül için R kodunu sorduğundan, işte burada
Kaynaklar
- Baguley, T. (2009). Standardized or simple effect size: what should be reported? British journal of psychology, 100(Pt 3), 603–17.
- Cohen, J. (1977). Statistical power analysis for the behavioral sciencies. Routledge.
- Furukawa, T. A., & Leucht, S. (2011). How to obtain NNT from Cohen’s d: comparison of two methods. PloS one, 6(4).
- Reiser, B., & Faraggi, D. (1999). Confidence intervals for the overlapping coefficient: the normal equal variance case. Journal of the Royal Statistical Society, 48(3), 413-418.
- Ruscio, J. (2008). A probability-based measure of effect size: robustness to base rates and other factors. Psychological methods, 13(1), 19–30.
- Ruscio, J., & Mullen, T. (2012). Confidence Intervals for the Probability of Superiority Effect Size Measure and the Area Under a Receiver Operating Characteristic Curve. Multivariate Behavioral Research, 47(2), 201–223.
Bu sayfaya nasıl atıf yapabilirim?
Favori stilinize göre bu sayfaya atıf yapın. Aşağıdaki referanslar otomatik olarak oluşturulur ve doğru bilgileri içerir.
APA 7
Magnusson, K. (2023). A Causal Inference Perspective on Therapist Effects. PsyArXiv. https://DOI
BibTex
Bir hatayı/açığı/yazım hatasını bildirmek veya bir öneride bulunmak istiyorum!
Lütfen ile GitHub’da bir konu açarak hatayı rapor edin veya öneride bulunun, GitHub tartışmaları kullanarak bir soru sormak isterseniz
Çok sayıda öğrenciden bu siteyi ziyaret etmelerini isteyeceğim. Sunucunuzu çökertir mi?
Hayır, iyi olacak. Uygulama tarayıcınızda çalışır, bu nedenle sunucunun yalnızca dosyaları sunması gerekir.
Örtüşme istatistiği, Cohen'in hesaplamalarından farklıdır
Bu kasıtlıdır, nedenlerim hakkında daha fazla bilgiyi bu blog gönderisinde okuyabilirsiniz: Where Cohen went wrong – the proportion of overlap between two normal distributions
Bu görselleştirmeyi kitabıma/makaleme/vb. dahil edebilir miyim?
Evet, devam et! Örtüşen iki Gauss dağılımını çizmeyi ben icat etmedim. Bu görselleştirme, kamuya adanmıştır; bu, “işleri ticari amaçlarla dahi olsa izin istemeden kopyalayabilir, değiştirebilir, dağıtabilir ve gerçekleştirebilirsiniz” anlamına gelir. (bakınız Creative common’s CC0-license). Atıf gerekli olmasa da, yapılması her zaman takdir edilir!
Bu sayfanın kaynak kodu MIT kullanılarak lisanslanmıştır ve sayfadaki metin CC-BY 4.0’dır.
Katkı/Bağış
Özgür ve açık yazılıma katkıda bulunmanın birçok yolu vardır. Çalışmamı beğendiyseniz ve desteklemek istiyorsanız şunları yapabilirsiniz:
Bana 422 kahve alan 175 destekçime kocaman teşekkürler!
Steffen ☕☕☕☕☕☕☕☕☕☕☕☕ (12) kahve aldı
I love your visualizations. Some of the best out there!!!
Jason Rinaldo ☕☕☕☕☕☕☕☕☕☕ (10) kahve aldı
I've been looking for applets that show this for YEARS, for demonstrations for classes. Thank you so much! Students do not need to tolarate my whiteboard scrawl now. I'm sure they'd appreciate you, too.l
Shawn Bergman ☕☕☕☕☕ (5) kahve aldı
Thank you for putting this together! I am using these visuals and this information to teach my Advanced Quant class.
anthonystevendick@gmail.com ☕☕☕☕☕ (5) kahve aldı
I've been using a lot of your ideas in a paper I'm writing and even borrowed some of your code (cited of course). But this site has been so helpful I think, in addition, I owe you a few coffees!
Chip Reichardt ☕☕☕☕☕ (5) kahve aldı
Hi Krisoffer, these are great applets and I've examined many. I'm writing a chapter for the second edition of "Teaching statistics and quantitative methods in the 21st century" by Joe Rodgers (Routledge). My chapter is on the use of applets in teaching statistics. I could well be describing 5 of yours. Would you permit me to publish one or more screen shots of the output from one or more of your applets. I promise I will be saying very positive things about your applets. If you are inclined to respond, my email address if Chip.Reichardt@du.edu.
Someone ☕☕☕☕☕ (5) kahve aldı
Someone ☕☕☕☕☕ (5) kahve aldı
Nice work! Saw some of your other publications and they are also really intriguing. Thanks so much!
JDMM ☕☕☕☕☕ (5) kahve aldı
You finally helped me understand correlation! Many, many thanks... 😄
@VicCazares ☕☕☕☕☕ (5) kahve aldı
Good stuff! It's been so helpful for teaching a Psych Stats class. Cheers!
Dustin M. Burt ☕☕☕☕☕ (5) kahve aldı
Excellent and informative visualizations!
Someone ☕☕☕☕☕ (5) kahve aldı
@metzpsych ☕☕☕☕☕ (5) kahve aldı
Always the clearest, loveliest simulations for complex concepts. Amazing resource for teaching intro stats!
Ryo ☕☕☕☕☕ (5) kahve aldı
For a couple years now I've been wanting to create visualizations like these as a way to commit these foundational concepts to memory. But after finding your website I'm both relieved that I don't have to do that now and pissed off that I couldn't create anything half as beautiful and informative as you have done here. Wonderful job.
Diarmuid Harvey ☕☕☕☕☕ (5) kahve aldı
You have an extremely useful site with very accessible content that I have been using to introduce colleagues and students to some of the core concepts of statistics. Keep up the good work, and thanks!
Michael Hansen ☕☕☕☕☕ (5) kahve aldı
Keep up the good work!
Michael Villanueva ☕☕☕☕☕ (5) kahve aldı
I wish I could learn more from you about stats and math -- you use language in places that I do not understand. Cohen's D visualizations opened my understanding. Thank you
Someone ☕☕☕☕☕ (5) kahve aldı
Thank you, Kristoffer
Pål from Norway ☕☕☕☕☕ (5) kahve aldı
Great webpage, I use it to illustrate several issues when I have a lecture in research methods. Thanks, it is really helpful for the students:)
@MAgrochao ☕☕☕☕☕ (5) kahve aldı
Joseph Bulbulia ☕☕☕☕☕ (5) kahve aldı
Hard to overstate the importance of this work Kristoffer. Grateful for all you are doing.
@TDmyersMT ☕☕☕☕☕ (5) kahve aldı
Some really useful simulations, great teaching resources.
@lakens ☕☕☕☕☕ (5) kahve aldı
Thanks for fixing the bug yesterday!
@LinneaGandhi ☕☕☕☕☕ (5) kahve aldı
This is awesome! Thank you for creating these. Definitely using for my students, and me! :-)
@ICH8412 ☕☕☕☕☕ (5) kahve aldı
very useful for my students I guess
@KelvinEJones ☕☕☕☕☕ (5) kahve aldı
Preparing my Master's student for final oral exam and stumbled on your site. We are discussing in lab meeting today. Coffee for everyone.
Someone ☕☕☕☕☕ (5) kahve aldı
What a great site
@Daniel_Brad4d ☕☕☕☕☕ (5) kahve aldı
Wonderful work!
David Loschelder ☕☕☕☕☕ (5) kahve aldı
Terrific work. So very helpful. Thank you very much.
@neilmeigh ☕☕☕☕☕ (5) kahve aldı
I am so grateful for your page and can't thank you enough!
@giladfeldman ☕☕☕☕☕ (5) kahve aldı
Wonderful work, I use it every semester and it really helps the students (and me) understand things better. Keep going strong.
Dean Norris ☕☕☕☕☕ (5) kahve aldı
Sal ☕☕☕☕☕ (5) kahve aldı
Really super useful, especially for teaching. Thanks for this!
dde@paxis.org ☕☕☕☕☕ (5) kahve aldı
Very helpful to helping teach teachers about the effects of the Good Behavior Game
@akreutzer82 ☕☕☕☕☕ (5) kahve aldı
Amazing visualizations! Thank you!
@rdh_CLE ☕☕☕☕☕ (5) kahve aldı
So good!
tchipman1@gsu.edu ☕☕☕ (3) kahve aldı
Hey, your stuff is cool - thanks for the visual
Hugo Quené ☕☕☕ (3) kahve aldı
Hi Kristoffer, Some time ago I've come up with a similar illustration about CIs as you have produced, and I'm now also referring to your work:<br>https://hugoquene.github.io/QMS-EN/ch-testing.html#sec:t-confidenceinterval-mean<br>With kind regards, Hugo Quené<br>(Utrecht University, Netherlands)
Tor ☕☕☕ (3) kahve aldı
Thanks so much for helping me understand these methods!
Amanda Sharples ☕☕☕ (3) kahve aldı
Soyol ☕☕☕ (3) kahve aldı
Someone ☕☕☕ (3) kahve aldı
Kenneth Nilsson ☕☕☕ (3) kahve aldı
Keep up the splendid work!
@jeremywilmer ☕☕☕ (3) kahve aldı
Love this website; use it all the time in my teaching and research.
Someone ☕☕☕ (3) kahve aldı
Powerlmm was really helpful, and I appreciate your time in putting such an amazing resource together!
DR AMANDA C DE C WILLIAMS ☕☕☕ (3) kahve aldı
This is very helpful, for my work and for teaching and supervising
Georgios Halkias ☕☕☕ (3) kahve aldı
Regina ☕☕☕ (3) kahve aldı
Love your visualizations!
Susan Evans ☕☕☕ (3) kahve aldı
Thanks. I really love the simplicity of your sliders. Thanks!!
@MichaMarie8 ☕☕☕ (3) kahve aldı
Thanks for making this Interpreting Correlations: Interactive Visualizations site - it's definitely a great help for this psych student! 😃
Zakaria Giunashvili, from Georgia ☕☕☕ (3) kahve aldı
brilliant simulations that can be effectively used in training
Someone ☕☕☕ (3) kahve aldı
@PhysioSven ☕☕☕ (3) kahve aldı
Amazing illustrations, there is not enough coffee in the world for enthusiasts like you! Thanks!
Cheryl@CurtinUniAus ☕☕☕ (3) kahve aldı
🌟What a great contribution - thanks Kristoffer!
vanessa moran ☕☕☕ (3) kahve aldı
Wow - your website is fantastic, thank you for making it.
Someone ☕☕☕ (3) kahve aldı
mikhail.saltychev@gmail.com ☕☕☕ (3) kahve aldı
Thank you Kristoffer This is a nice site, which I have been used for a while. Best Prof. Mikhail Saltychev (Turku University, Finland)
Someone ☕☕☕ (3) kahve aldı
Ruslan Klymentiev ☕☕☕ (3) kahve aldı
@lkizbok ☕☕☕ (3) kahve aldı
Keep up the nice work, thank you!
@TELLlab ☕☕☕ (3) kahve aldı
Thanks - this will help me to teach tomorrow!
SCCT/Psychology ☕☕☕ (3) kahve aldı
Keep the visualizations coming!
@elena_bolt ☕☕☕ (3) kahve aldı
Thank you so much for your work, Kristoffer. I use your visualizations to explain concepts to my tutoring students and they are a huge help.
A random user ☕☕☕ (3) kahve aldı
Thank you for making such useful and pretty tools. It not only helped me understand more about power, effect size, etc, but also made my quanti-method class more engaging and interesting. Thank you and wish you a great 2021!
@hertzpodcast ☕☕☕ (3) kahve aldı
We've mentioned your work a few times on our podcast and we recently sent a poster to a listener as prize so we wanted to buy you a few coffees. Thanks for the great work that you do!Dan Quintana and James Heathers - Co-hosts of Everything Hertz
Cameron Proctor ☕☕☕ (3) kahve aldı
Used your vizualization in class today. Thanks!
eshulman@brocku.ca ☕☕☕ (3) kahve aldı
My students love these visualizations and so do I! Thanks for helping me make stats more intuitive.
Someone ☕☕☕ (3) kahve aldı
Adrian Helgå Vestøl ☕☕☕ (3) kahve aldı
@misteryosupjoo ☕☕☕ (3) kahve aldı
For a high school teacher of psychology, I would be lost without your visualizations. The ability to interact and manipulate allows students to get it in a very sticky manner. Thank you!!!
Chi ☕☕☕ (3) kahve aldı
You Cohen's d post really helped me explaining the interpretation to people who don't know stats! Thank you!
Someone ☕☕☕ (3) kahve aldı
You doing useful work !! thanks !!
@ArtisanalANN ☕☕☕ (3) kahve aldı
Enjoy.
@jsholtes ☕☕☕ (3) kahve aldı
Teaching stats to civil engineer undergrads (first time teaching for me, first time for most of them too) and grasping for some good explanations of hypothesis testing, power, and CI's. Love these interactive graphics!
@notawful ☕☕☕ (3) kahve aldı
Thank you for using your stats and programming gifts in such a useful, generous manner. -Jess
Mateu Servera ☕☕☕ (3) kahve aldı
A job that must have cost far more coffees than we can afford you ;-). Thank you.
@cdrawn ☕☕☕ (3) kahve aldı
Thank you! Such a great resource for teaching these concepts, especially CI, Power, correlation.
Julia ☕☕☕ (3) kahve aldı
Fantastic work with the visualizations!
@felixthoemmes ☕☕☕ (3) kahve aldı
@dalejbarr ☕☕☕ (3) kahve aldı
Your work is amazing! I use your visualizations often in my teaching. Thank you.
@PsychoMouse ☕☕☕ (3) kahve aldı
Excellent! Well done! SOOOO Useful!😊 🐭
Someone ☕☕ (2) kahve aldı
Thanks, your work is great!!
Dan Sanes ☕☕ (2) kahve aldı
this is a superb, intuitive teaching tool!
@whlevine ☕☕ (2) kahve aldı
Thank you so much for these amazing visualizations. They're a great teaching tool and the allow me to show students things that it would take me weeks or months to program myself.
Someone ☕☕ (2) kahve aldı
@notawful ☕☕ (2) kahve aldı
Thank you for sharing your visualization skills with the rest of us! I use them frequently when teaching intro stats.
Someone ☕ (1) kahve aldı
You are awesome
Thom Marchbank ☕ (1) kahve aldı
Your visualisations are so useful! Thank you so much for your work.
georgina g. ☕ (1) kahve aldı
thanks for helping me in my psych degree!
Someone ☕ (1) kahve aldı
Thank You for this work.
Kosaku Noba ☕ (1) kahve aldı
Nice visualization, I bought a cup of coffee.
Someone ☕ (1) kahve aldı
Thomas ☕ (1) kahve aldı
Great. Use it for teaching in psychology.
Someone ☕ (1) kahve aldı
It is the best statistics visualization so far!
Ergun Pascu ☕ (1) kahve aldı
AMAZING Tool!!! Thank You!
Ann Calhoun-Sauls ☕ (1) kahve aldı
This has been a wonderful resource for my statistics and research methods classes. I also occassionally use it for other courses such as Theories of Personality and Social Psychology
David Britt ☕ (1) kahve aldı
nicely reasoned
Mike ☕ (1) kahve aldı
I appreciate your making this site available. Statistics are not in my wheelhouse, but the ability to display my data more meaningfully in my statistics class is both educational and visually appealing. Thank you!
Jayne T Jacobs ☕ (1) kahve aldı
Andrew J O'Neill ☕ (1) kahve aldı
Thanks for helping understand stuff!
Someone ☕ (1) kahve aldı
Someone ☕ (1) kahve aldı
Shawn Hemelstrand ☕ (1) kahve aldı
Thank you for this great visual. I use it all the time to demonstrate Cohen's d and why mean differences affect it's approximation.
Adele Fowler-Davis ☕ (1) kahve aldı
Thank you so much for your excellent post on longitudinal models. Keep up the good work!
Stewart ☕ (1) kahve aldı
This tool is awesome!
Someone ☕ (1) kahve aldı
Aidan Nelson ☕ (1) kahve aldı
Such an awesome page, Thank you
Someone ☕ (1) kahve aldı
Ellen Kearns ☕ (1) kahve aldı
Dr Nazam Hussain ☕ (1) kahve aldı
Someone ☕ (1) kahve aldı
Eva ☕ (1) kahve aldı
I've been learning about power analysis and effect sizes (trying to decide on effect sizes for my planned study to calculate sample size) and your Cohen's d interactive tool is incredibly useful for understanding the implications of different effect sizes!
Someone ☕ (1) kahve aldı
Someone ☕ (1) kahve aldı
Thanks a lot!
Someone ☕ (1) kahve aldı
Reena Murmu Nielsen ☕ (1) kahve aldı
Tony Andrea ☕ (1) kahve aldı
Thanks mate
Tzao ☕ (1) kahve aldı
Thank you, this really helps as I am a stats idiot :)
Melanie Pflaum ☕ (1) kahve aldı
Sacha Elms ☕ (1) kahve aldı
Yihan Xu ☕ (1) kahve aldı
Really appreciate your good work!
@stevenleung ☕ (1) kahve aldı
Your visualizations really help me understand the math.
Junhan Chen ☕ (1) kahve aldı
Someone ☕ (1) kahve aldı
Someone ☕ (1) kahve aldı
Michael Hansen ☕ (1) kahve aldı
ALEXANDER VIETHEER ☕ (1) kahve aldı
mather ☕ (1) kahve aldı
Someone ☕ (1) kahve aldı
Bastian Jaeger ☕ (1) kahve aldı
Thanks for making the poster designs OA, I just hung two in my office and they look great!
@ValerioVillani ☕ (1) kahve aldı
Thanks for your work.
Someone ☕ (1) kahve aldı
Great work!
@YashvinSeetahul ☕ (1) kahve aldı
Someone ☕ (1) kahve aldı
Angela ☕ (1) kahve aldı
Thank you for building such excellent ways to convey difficult topics to students!
@inthelabagain ☕ (1) kahve aldı
Really wonderful visuals, and such a fantastic and effective teaching tool. So many thanks!
Someone ☕ (1) kahve aldı
Someone ☕ (1) kahve aldı
Yashashree Panda ☕ (1) kahve aldı
I really like your work.
Ben ☕ (1) kahve aldı
You're awesome. I have students in my intro stats class say, "I get it now," after using your tool. Thanks for making my job easier.
Gabriel Recchia ☕ (1) kahve aldı
Incredibly useful tool!
Shiseida Sade Kelly Aponte ☕ (1) kahve aldı
Thanks for the assistance for RSCH 8210.
@Benedikt_Hell ☕ (1) kahve aldı
Great tools! Thank you very much!
Amalia Alvarez ☕ (1) kahve aldı
@noelnguyen16 ☕ (1) kahve aldı
Hi Kristoffer, many thanks for making all this great stuff available to the community!
Eran Barzilai ☕ (1) kahve aldı
These visualizations are awesome! thank you for creating it
Someone ☕ (1) kahve aldı
Chris SG ☕ (1) kahve aldı
Very nice.
Gray Church ☕ (1) kahve aldı
Thank you for the visualizations. They are fun and informative.
Qamar ☕ (1) kahve aldı
Tanya McGhee ☕ (1) kahve aldı
@schultemi ☕ (1) kahve aldı
Neilo ☕ (1) kahve aldı
Really helpful visualisations, thanks!
Someone ☕ (1) kahve aldı
This is amazing stuff. Very slick.
Someone ☕ (1) kahve aldı
Sarko ☕ (1) kahve aldı
Thanks so much for creating this! Really helpful for being able to explain effect size to a clinician I'm doing an analysis for.
@DominikaSlus ☕ (1) kahve aldı
Thank you! This page is super useful. I'll spread the word.
Someone ☕ (1) kahve aldı
Melinda Rice ☕ (1) kahve aldı
Thank you so much for creating these tools! As we face the challenge of teaching statistical concepts online, this is an invaluable resource.
@tmoldwin ☕ (1) kahve aldı
Fantastic resource. I think you would be well served to have one page indexing all your visualizations, that would make it more accessible for sharing as a common resource.
Someone ☕ (1) kahve aldı
Fantastic Visualizations! Amazing way to to demonstrate how n/power/beta/alpha/effect size are all interrelated - especially for visual learners! Thank you for creating this?
@jackferd ☕ (1) kahve aldı
Incredible visualizations and the best power analysis software on R.
Cameron Proctor ☕ (1) kahve aldı
Great website!
Someone ☕ (1) kahve aldı
Hanah Chapman ☕ (1) kahve aldı
Thank you for this work!!
Someone ☕ (1) kahve aldı
Jayme ☕ (1) kahve aldı
Nice explanation and visual guide of Cohen's d
Bart Comly Boyce ☕ (1) kahve aldı
thank you
Dr. Mitchell Earleywine ☕ (1) kahve aldı
This site is superb!
Florent ☕ (1) kahve aldı
Zampeta ☕ (1) kahve aldı
thank you for sharing your work.
Mila ☕ (1) kahve aldı
Thank you for the website, made me smile AND smarter :O enjoy your coffee! :)
Deb ☕ (1) kahve aldı
Struggling with statistics and your interactive diagram made me smile to see that someone cares enough about us strugglers to make a visual to help us out!😍
Someone ☕ (1) kahve aldı
@exerpsysing ☕ (1) kahve aldı
Much thanks! Visualizations are key to my learning style!
Someone ☕ (1) kahve aldı
Sponsorlar
GitHub Sponsorlarını kullanarak açık kaynak çalışmalarıma sponsor olabilir ve adınızın burada gösterilmesini sağlayabilirsiniz.
Destekleyenler ✨❤️
Çekme istekleri (pull requests) kabul edilir. Yeni özellikler önererek, faydalı referanslar ekleyerek veya yazım hatalarını düzeltmeye yardımcı olarak katkıda bulunabilirsiniz. GitHub'da bir konu başlığı açmanız yeterlidir.
Daha Fazla Görselleştirme

PowerLMM.js
Sample size planning for longitudinal models with missing data
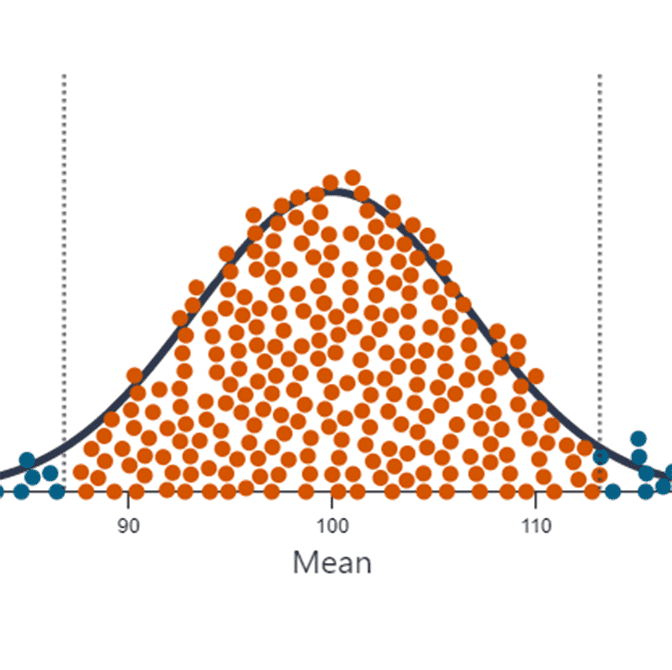
Understanding p-values Through Simulations
An interactive simulation to help explain p-values
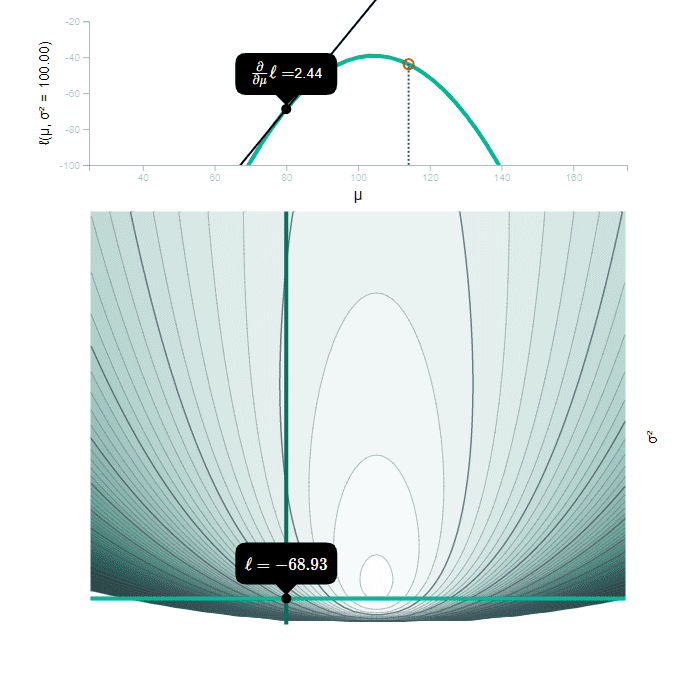
Maximum Likelihood
An interactive post covering various aspects of maximum likelihood estimation.

Cohen's d
An interactive app to visualize and understand standardized effect sizes.
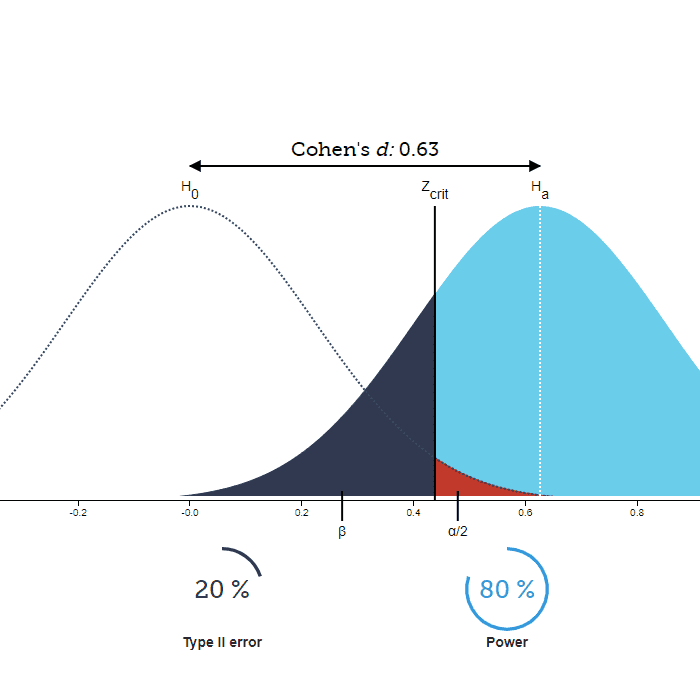
Statistical Power and Significance Testing
An interactive version of the traditional Type I and II error illustration.
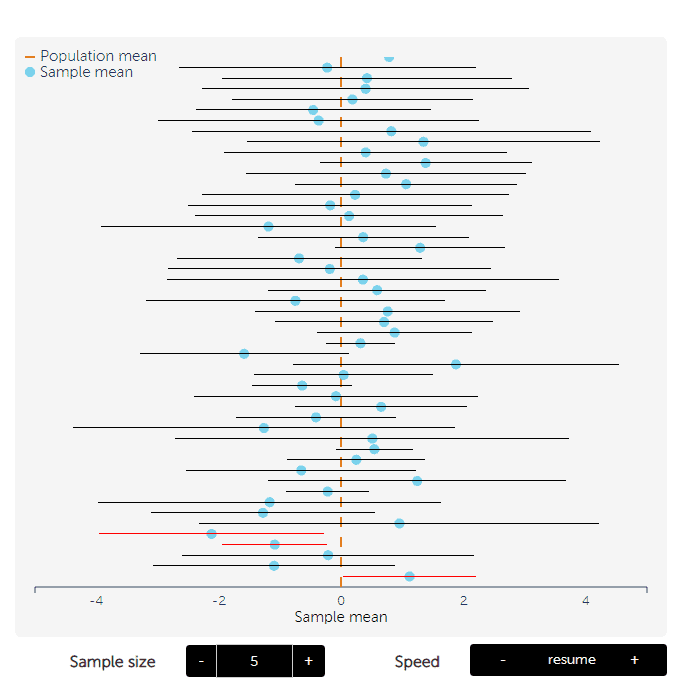
Confidence Intervals
An interactive simulation of confidence intervals
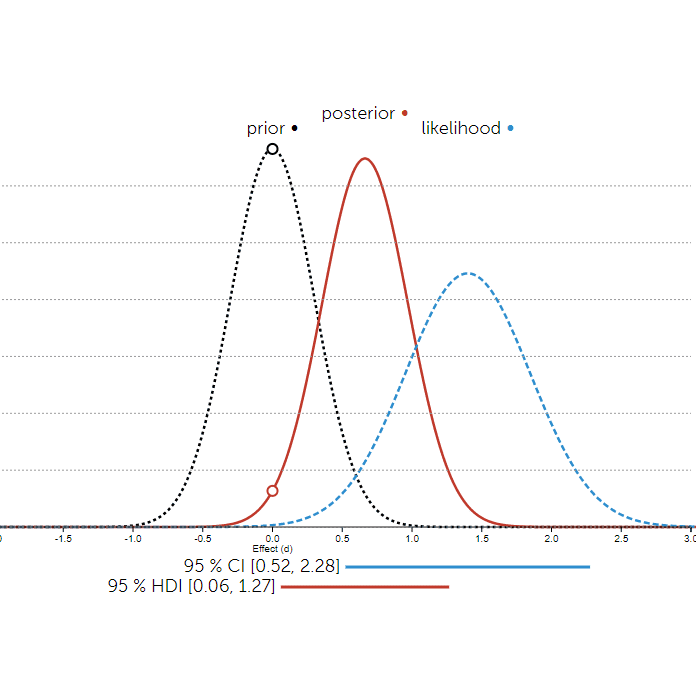
Bayesian Inference
An interactive illustration of prior, likelihood, and posterior.

Correlations
Interactive scatterplot that lets you visualize correlations of various magnitudes.

Equivalence and Non-Inferiority Testing
Explore how superiority, non-inferiority, and equivalence testing relates to a confidence interval
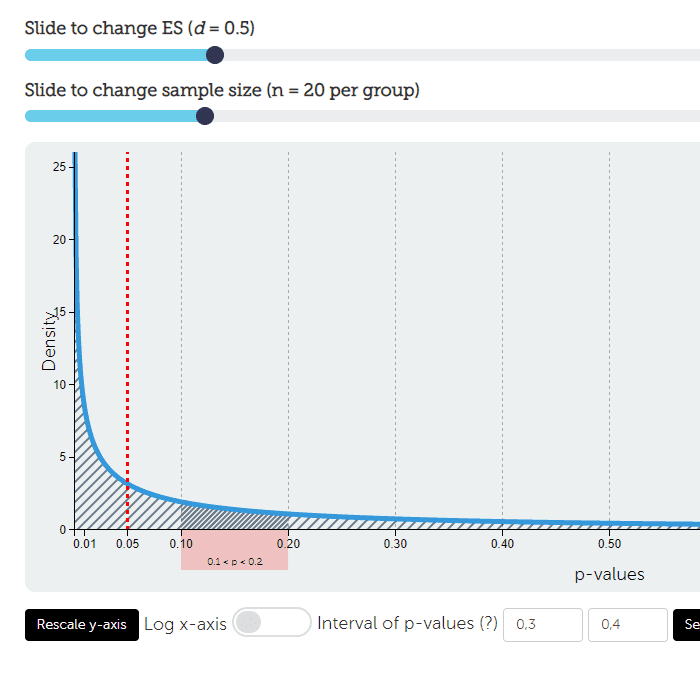
P-value distribution
Explore the expected distribution of p-values under varying alternative hypothesises.

t-distribution
Interactively compare the t- and normal distribution.